|
Download Data (XLS File) |
|
||||||||
|
||||||||
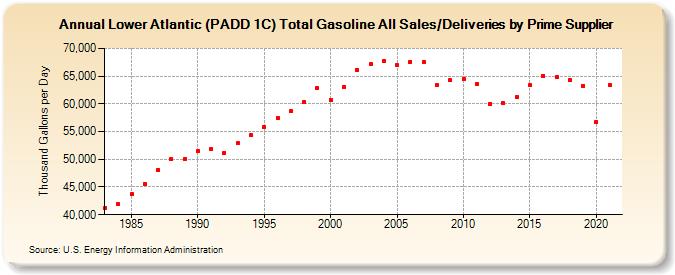
| Lower Atlantic (PADD 1C) Total Gasoline All Sales/Deliveries by Prime Supplier (Thousand Gallons per Day) | ||||||||
| Decade | Year-0 | Year-1 | Year-2 | Year-3 | Year-4 | Year-5 | Year-6 | Year-7 | Year-8 | Year-9 |
|---|---|---|---|---|---|---|---|---|---|---|
| 1980's | 41,231.6 | 41,844.6 | 43,697.1 | 45,617.5 | 48,126.7 | 49,997.7 | 50,038.0 | |||
| 1990's | 51,437.3 | 51,852.0 | 51,205.6 | 52,872.5 | 54,296.9 | 55,833.7 | 57,464.1 | 58,645.6 | 60,297.3 | 62,796.4 |
| 2000's | 60,744.3 | 63,039.9 | 66,072.0 | 67,160.6 | 67,810.7 | 66,933.4 | 67,590.8 | 67,576.5 | 63,393.2 | 64,247.7 |
| 2010's | 64,541.0 | 63,649.1 | 60,053.7 | 60,112.5 | 61,261.5 | 63,316.8 | 65,101.9 | 64,852.4 | 64,328.6 | 63,268.9 |
| 2020's | 56,740.2 |
| - = No Data Reported; -- = Not Applicable; NA = Not Available; W = Withheld to avoid disclosure of individual company data. |
| Release Date: 6/1/2022 |
| Next Release Date: TBD |