|
Download Data (XLS File) |
|
||||||||
|
||||||||
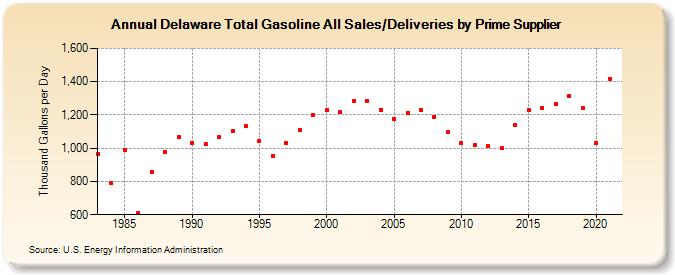
| Delaware Total Gasoline All Sales/Deliveries by Prime Supplier (Thousand Gallons per Day) | ||||||||
| Decade | Year-0 | Year-1 | Year-2 | Year-3 | Year-4 | Year-5 | Year-6 | Year-7 | Year-8 | Year-9 |
|---|---|---|---|---|---|---|---|---|---|---|
| 1980's | 967.5 | 791.1 | 991.6 | 607.8 | 859.4 | 975.4 | 1,066.2 | |||
| 1990's | 1,032.6 | 1,022.5 | 1,067.3 | 1,102.8 | 1,134.3 | 1,043.3 | 955.0 | 1,028.3 | 1,107.6 | 1,201.7 |
| 2000's | 1,227.4 | 1,214.9 | 1,282.6 | 1,281.4 | 1,228.8 | 1,174.7 | 1,211.5 | 1,229.7 | 1,187.7 | 1,094.8 |
| 2010's | 1,030.8 | 1,016.9 | 1,010.5 | 998.6 | 1,136.7 | 1,227.6 | 1,243.8 | 1,265.7 | 1,315.6 | 1,242.1 |
| 2020's | 1,030.5 |
| - = No Data Reported; -- = Not Applicable; NA = Not Available; W = Withheld to avoid disclosure of individual company data. |
| Release Date: 6/1/2022 |
| Next Release Date: TBD |