|
Download Data (XLS File) |
|
||||||||
|
||||||||
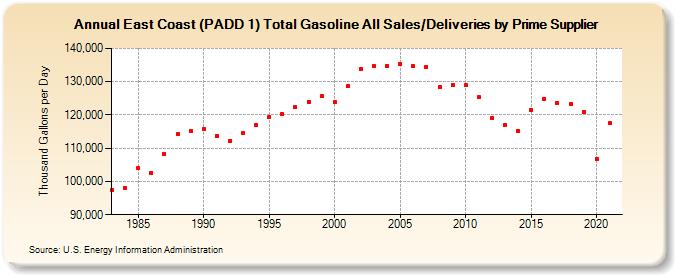
| East Coast (PADD 1) Total Gasoline All Sales/Deliveries by Prime Supplier (Thousand Gallons per Day) | ||||||||
| Decade | Year-0 | Year-1 | Year-2 | Year-3 | Year-4 | Year-5 | Year-6 | Year-7 | Year-8 | Year-9 |
|---|---|---|---|---|---|---|---|---|---|---|
| 1980's | 97,335.4 | 98,114.3 | 104,054.1 | 102,545.7 | 108,315.4 | 114,220.0 | 115,245.1 | |||
| 1990's | 115,810.4 | 113,806.8 | 112,270.1 | 114,453.1 | 116,937.3 | 119,444.6 | 120,315.7 | 122,246.0 | 123,938.1 | 125,686.6 |
| 2000's | 123,868.8 | 128,578.6 | 133,776.9 | 134,637.9 | 134,775.2 | 135,243.5 | 134,618.6 | 134,534.8 | 128,463.4 | 129,135.1 |
| 2010's | 128,893.5 | 125,252.4 | 119,021.3 | 117,031.7 | 115,225.0 | 121,544.4 | 124,794.1 | 123,678.9 | 123,230.9 | 120,996.1 |
| 2020's | 106,755.9 |
| - = No Data Reported; -- = Not Applicable; NA = Not Available; W = Withheld to avoid disclosure of individual company data. |
| Release Date: 6/1/2022 |
| Next Release Date: TBD |