|
Download Data (XLS File) |
|
||||||||
|
||||||||
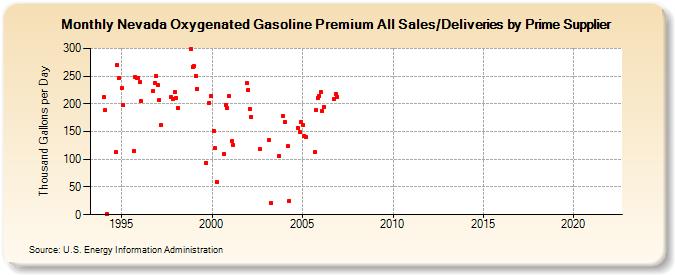
| Nevada Oxygenated Gasoline Premium All Sales/Deliveries by Prime Supplier (Thousand Gallons per Day) | ||||||||
| Year | Jan | Feb | Mar | Apr | May | Jun | Jul | Aug | Sep | Oct | Nov | Dec |
|---|---|---|---|---|---|---|---|---|---|---|---|---|
| 1993 | NA | NA | NA | |||||||||
| 1994 | 211.5 | 188.8 | 0.7 | W | - | W | W | - | 113.1 | 270.2 | 246.4 | W |
| 1995 | 229.1 | 197.5 | W | W | W | W | W | W | 115.1 | 248.7 | 246.7 | 247.2 |
| 1996 | 238.7 | 204.5 | W | W | W | W | W | W | W | 223.4 | 238.4 | 250.3 |
| 1997 | 233.5 | 206.5 | 161.4 | W | - | - | - | - | W | 211.7 | 209.6 | 221.3 |
| 1998 | 211.3 | 192.3 | W | W | - | - | - | - | W | W | 299.0 | 266.2 |
| 1999 | 267.9 | 250.6 | 227.2 | W | - | - | - | - | 93.8 | W | 201.5 | 214.4 |
| 2000 | W | 151.7 | 119.7 | 59.8 | W | W | W | W | 109.1 | 198.6 | 192.1 | 213.4 |
| 2001 | W | 132.1 | 126.6 | W | - | - | - | - | W | W | W | 237.1 |
| 2002 | 225.7 | 191.0 | 177.0 | W | - | - | - | - | 117.8 | W | W | W |
| 2003 | W | W | 135.5 | 22.0 | - | - | - | - | 105.8 | W | W | 178.7 |
| 2004 | 168.1 | W | 123.6 | 25.0 | - | - | - | - | W | 156.9 | 149.2 | 167.8 |
| 2005 | 162.6 | 141.2 | 139.9 | W | - | - | - | - | 112.4 | 188.0 | 211.4 | 214.7 |
| 2006 | 220.6 | 187.7 | 194.6 | W | - | - | - | - | W | 208.9 | 217.5 | 212.9 |
| 2007 | - | - | - | - | - | - | - | - | - | - | - | - |
| 2008 | - | - | - | - | - | - | - | - | - | - | - | - |
| 2009 | - | - | - | - | - | - | - | - | - | - | - | - |
| 2010 | - | - | - | - | - | - | - | - | - | - | - | - |
| 2011 | - | - | - | - | - | - | - | - | - | - | - | - |
| 2012 | - | - | - | - | - | - | - | - | - | - | - | - |
| 2013 | - | - | - | - | - | - | - | - | - | - | - | - |
| 2014 | - | - | - | - | - | - | - | - | - | - | - | - |
| 2015 | - | - | - | - | - | - | - | - | - | - | - | - |
| 2016 | - | - | - | - | - | - | - | - | - | - | - | - |
| 2017 | - | - | - | - | - | - | - | - | - | - | - | - |
| 2018 | - | - | - | - | - | - | - | - | - | - | - | - |
| 2019 | - | - | - | - | - | - | - | - | - | - | - | - |
| 2020 | - | - | - | - | - | - | - | - | - | - | - | - |
| 2021 | - | - | - | - | - | - | - | - | - | - | - | - |
| 2022 | - | - | - | |||||||||
| - = No Data Reported; -- = Not Applicable; NA = Not Available; W = Withheld to avoid disclosure of individual company data. |
| Release Date: 5/19/2022 |
| Next Release Date: TBD |