|
Download Data (XLS File) |
|
||||||||
|
||||||||
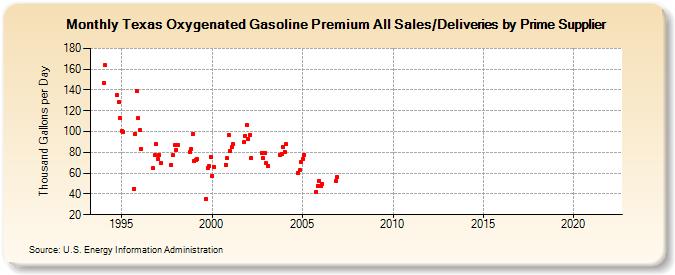
| Texas Oxygenated Gasoline Premium All Sales/Deliveries by Prime Supplier (Thousand Gallons per Day) | ||||||||
| Year | Jan | Feb | Mar | Apr | May | Jun | Jul | Aug | Sep | Oct | Nov | Dec |
|---|---|---|---|---|---|---|---|---|---|---|---|---|
| 1993 | NA | NA | NA | |||||||||
| 1994 | 147.0 | 163.6 | W | W | W | W | W | W | W | 134.9 | 128.4 | 113.5 |
| 1995 | 100.5 | 99.7 | W | W | - | - | - | - | 45.0 | 97.7 | 139.3 | 112.7 |
| 1996 | 101.2 | 83.4 | W | W | W | - | - | - | W | 64.6 | 77.4 | 87.9 |
| 1997 | 73.8 | 77.3 | 70.0 | W | - | - | - | - | W | 68.2 | 77.4 | 86.6 |
| 1998 | 82.5 | 87.0 | W | W | - | - | - | - | W | 80.2 | 82.9 | 97.2 |
| 1999 | 71.5 | 72.9 | 73.2 | W | - | - | - | - | 35.5 | 65.3 | 66.5 | 76.0 |
| 2000 | 57.5 | 66.3 | W | W | - | - | - | - | W | 68.1 | 74.2 | 96.3 |
| 2001 | 81.1 | 84.9 | 87.7 | W | W | - | - | - | W | 89.8 | 95.6 | 106.0 |
| 2002 | 93.0 | 97.1 | 74.5 | - | - | - | - | - | W | 79.5 | 74.1 | 79.6 |
| 2003 | 69.3 | 67.1 | W | - | - | - | - | - | W | 77.9 | 78.4 | 84.9 |
| 2004 | 80.5 | 88.0 | W | W | - | - | - | - | W | 60.2 | 63.0 | 70.6 |
| 2005 | 74.0 | 77.6 | W | - | - | - | - | - | W | 42.2 | 47.9 | 52.4 |
| 2006 | 47.8 | 49.6 | W | - | - | - | - | - | W | W | 52.9 | 56.3 |
| 2007 | - | - | - | - | - | - | - | - | - | - | - | - |
| 2008 | - | - | - | - | - | - | - | - | - | - | - | - |
| 2009 | - | - | - | - | - | - | - | - | - | - | - | - |
| 2010 | - | - | - | - | - | - | - | - | - | - | - | - |
| 2011 | - | - | - | - | - | - | - | - | - | - | - | - |
| 2012 | - | - | - | - | - | - | - | - | - | - | - | - |
| 2013 | - | - | - | - | - | - | - | - | - | - | - | - |
| 2014 | - | - | - | - | - | - | - | - | - | - | - | - |
| 2015 | - | - | - | - | - | - | - | - | - | - | - | - |
| 2016 | - | - | - | - | - | - | - | - | - | - | - | - |
| 2017 | - | - | - | - | - | - | - | - | - | - | - | - |
| 2018 | - | - | - | - | - | - | - | - | - | - | - | - |
| 2019 | - | - | - | - | - | - | - | - | - | - | - | - |
| 2020 | - | - | - | - | - | - | - | - | - | - | - | - |
| 2021 | - | - | - | - | - | - | - | - | - | - | - | - |
| 2022 | - | - | - | |||||||||
| - = No Data Reported; -- = Not Applicable; NA = Not Available; W = Withheld to avoid disclosure of individual company data. |
| Release Date: 5/19/2022 |
| Next Release Date: TBD |