|
Download Data (XLS File) |
|
||||||||
|
||||||||
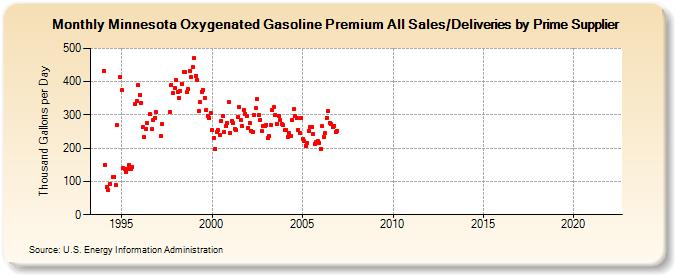
| Minnesota Oxygenated Gasoline Premium All Sales/Deliveries by Prime Supplier (Thousand Gallons per Day) | ||||||||
| Year | Jan | Feb | Mar | Apr | May | Jun | Jul | Aug | Sep | Oct | Nov | Dec |
|---|---|---|---|---|---|---|---|---|---|---|---|---|
| 1993 | NA | NA | NA | |||||||||
| 1994 | 433.1 | 150.4 | 83.6 | 73.2 | 93.8 | W | 114.6 | 113.8 | 90.6 | 268.9 | W | 412.9 |
| 1995 | 374.5 | 141.5 | 136.1 | 129.0 | 136.3 | 149.0 | 137.9 | 144.9 | W | 331.4 | 342.3 | 389.4 |
| 1996 | 360.7 | 337.1 | 262.2 | 232.5 | 258.5 | 275.1 | W | 301.6 | 258.4 | 285.1 | 291.4 | 307.5 |
| 1997 | W | W | 236.1 | 272.7 | W | W | W | W | 308.4 | 390.3 | 365.8 | 380.8 |
| 1998 | 404.1 | 369.1 | 351.4 | 372.7 | 393.7 | 430.4 | 428.1 | 368.0 | 377.5 | 433.4 | 414.5 | 443.6 |
| 1999 | 471.6 | 417.8 | 405.2 | 311.0 | 337.7 | 370.1 | 376.4 | 351.0 | 314.2 | 296.9 | 290.1 | 305.1 |
| 2000 | 253.9 | 232.1 | 198.7 | 248.6 | 253.2 | 240.3 | 281.8 | 296.4 | 248.7 | 266.3 | 275.6 | 337.7 |
| 2001 | 246.4 | 282.0 | 275.5 | 257.1 | 254.1 | 295.2 | 322.4 | 284.2 | 265.8 | 314.9 | 303.6 | 297.4 |
| 2002 | 260.7 | 276.7 | 252.6 | 249.2 | 299.2 | 319.3 | 348.4 | 298.9 | 285.3 | 250.2 | 267.3 | 268.0 |
| 2003 | 269.9 | 230.8 | 235.3 | 268.5 | 315.5 | 322.8 | 299.3 | 273.0 | 296.8 | 284.5 | 272.2 | 268.6 |
| 2004 | 253.8 | 255.4 | 233.9 | 244.7 | 237.7 | 286.2 | 316.9 | 297.7 | 289.7 | 255.8 | 246.3 | 290.4 |
| 2005 | 227.0 | 220.9 | 206.8 | 216.7 | 251.8 | 262.5 | 262.5 | 243.5 | 212.8 | 218.5 | 221.8 | 216.4 |
| 2006 | 197.9 | 265.5 | 233.0 | 244.2 | 291.7 | 310.5 | 277.1 | 271.3 | 265.1 | 267.5 | 249.0 | 252.8 |
| 2007 | - | - | - | - | - | - | - | - | - | - | - | - |
| 2008 | - | - | - | - | - | - | - | - | - | - | - | - |
| 2009 | - | - | - | - | - | - | - | - | - | - | - | - |
| 2010 | - | - | - | - | - | - | - | - | - | - | - | - |
| 2011 | - | - | - | - | - | - | - | - | - | - | - | - |
| 2012 | - | - | - | - | - | - | - | - | - | - | - | - |
| 2013 | - | - | - | - | - | - | - | - | - | - | - | - |
| 2014 | - | - | - | - | - | - | - | - | - | - | - | - |
| 2015 | - | - | - | - | - | - | - | - | - | - | - | - |
| 2016 | - | - | - | - | - | - | - | - | - | - | - | - |
| 2017 | - | - | - | - | - | - | - | - | - | - | - | - |
| 2018 | - | - | - | - | - | - | - | - | - | - | - | - |
| 2019 | - | - | - | - | - | - | - | - | - | - | - | - |
| 2020 | - | - | - | - | - | - | - | - | - | - | - | - |
| 2021 | - | - | - | - | - | - | - | - | - | - | - | - |
| 2022 | - | - | - | |||||||||
| - = No Data Reported; -- = Not Applicable; NA = Not Available; W = Withheld to avoid disclosure of individual company data. |
| Release Date: 5/19/2022 |
| Next Release Date: TBD |