|
Download Data (XLS File) |
|
||||||||
|
||||||||
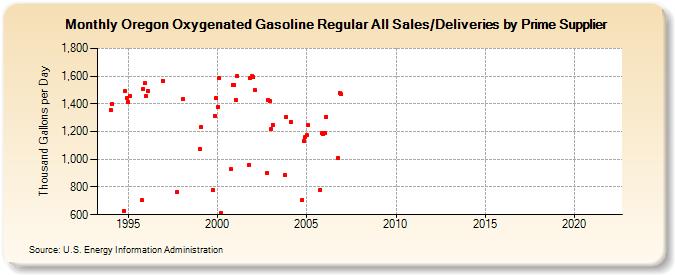
| Oregon Oxygenated Gasoline Regular All Sales/Deliveries by Prime Supplier (Thousand Gallons per Day) | ||||||||
| Year | Jan | Feb | Mar | Apr | May | Jun | Jul | Aug | Sep | Oct | Nov | Dec |
|---|---|---|---|---|---|---|---|---|---|---|---|---|
| 1993 | NA | NA | NA | |||||||||
| 1994 | 1,355.8 | 1,398.5 | W | W | - | - | - | W | W | 626.8 | 1,490.7 | 1,442.6 |
| 1995 | 1,410.5 | 1,459.9 | W | W | W | W | W | W | W | 704.1 | 1,507.6 | 1,548.2 |
| 1996 | 1,457.2 | 1,495.7 | W | W | W | W | W | W | W | W | W | 1,565.8 |
| 1997 | W | W | W | W | W | W | W | W | W | 763.8 | W | W |
| 1998 | W | 1,431.4 | W | W | W | W | W | W | W | W | W | W |
| 1999 | 1,075.5 | 1,231.9 | W | W | W | W | W | W | W | 774.8 | 1,313.2 | 1,441.2 |
| 2000 | 1,376.4 | 1,584.4 | 612.8 | W | W | W | W | W | W | 927.9 | 1,537.5 | 1,533.9 |
| 2001 | 1,429.8 | 1,600.4 | W | W | W | W | W | W | W | 959.2 | 1,589.1 | 1,600.2 |
| 2002 | 1,593.1 | 1,499.3 | W | W | W | W | W | W | W | 902.6 | 1,426.1 | 1,421.4 |
| 2003 | 1,218.8 | 1,249.3 | W | W | W | W | W | W | W | 886.0 | 1,304.5 | W |
| 2004 | W | 1,271.2 | W | W | W | W | W | W | NA | 706.4 | 1,132.0 | 1,160.9 |
| 2005 | 1,172.8 | 1,244.7 | W | W | W | W | W | W | W | 781.5 | 1,188.9 | 1,182.0 |
| 2006 | 1,187.2 | 1,306.0 | W | W | W | W | W | W | W | 1,010.7 | 1,480.6 | 1,467.7 |
| 2007 | - | - | - | - | - | - | - | - | - | - | - | - |
| 2008 | - | - | - | - | - | - | - | - | - | - | - | - |
| 2009 | - | - | - | - | - | - | - | - | - | - | - | - |
| 2010 | - | - | - | - | - | - | - | - | - | - | - | - |
| 2011 | - | - | - | - | - | - | - | - | - | - | - | - |
| 2012 | - | - | - | - | - | - | - | - | - | - | - | - |
| 2013 | - | - | - | - | - | - | - | - | - | - | - | - |
| 2014 | - | - | - | - | - | - | - | - | - | - | - | - |
| 2015 | - | - | - | - | - | - | - | - | - | - | - | - |
| 2016 | - | - | - | - | - | - | - | - | - | - | - | - |
| 2017 | - | - | - | - | - | - | - | - | - | - | - | - |
| 2018 | - | - | - | - | - | - | - | - | - | - | - | - |
| 2019 | - | - | - | - | - | - | - | - | - | - | - | - |
| 2020 | - | - | - | - | - | - | - | - | - | - | - | - |
| 2021 | - | - | - | - | - | - | - | - | - | - | - | - |
| 2022 | - | - | - | |||||||||
| - = No Data Reported; -- = Not Applicable; NA = Not Available; W = Withheld to avoid disclosure of individual company data. |
| Release Date: 5/19/2022 |
| Next Release Date: TBD |