|
Download Data (XLS File) |
|
||||||||
|
||||||||
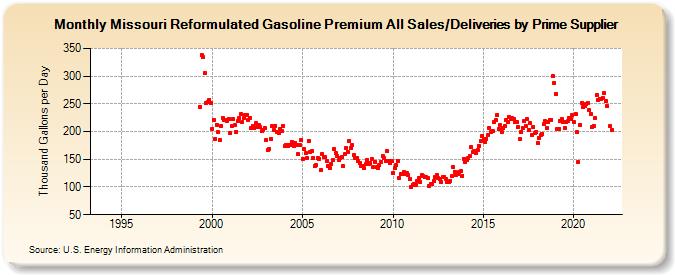
| Missouri Reformulated Gasoline Premium All Sales/Deliveries by Prime Supplier (Thousand Gallons per Day) | ||||||||
| Year | Jan | Feb | Mar | Apr | May | Jun | Jul | Aug | Sep | Oct | Nov | Dec |
|---|---|---|---|---|---|---|---|---|---|---|---|---|
| 1993 | - | - | - | |||||||||
| 1994 | - | - | - | - | - | - | - | - | - | - | - | - |
| 1995 | - | - | - | - | - | - | - | - | - | - | - | - |
| 1996 | - | - | - | - | - | - | - | - | - | - | - | - |
| 1997 | - | - | - | - | - | - | - | - | - | - | - | - |
| 1998 | - | - | - | - | - | - | - | - | - | - | - | - |
| 1999 | - | - | - | W | 244.6 | 337.3 | 334.7 | 305.3 | 251.9 | 253.4 | 257.4 | 251.6 |
| 2000 | 205.4 | 221.4 | 186.9 | 212.3 | 198.3 | 184.9 | 210.2 | 224.9 | 221.1 | 221.0 | 219.9 | 223.0 |
| 2001 | 196.7 | 209.9 | 222.2 | 211.1 | 200.0 | 219.4 | 224.5 | 231.5 | 217.3 | 225.0 | 229.6 | 230.6 |
| 2002 | 220.3 | 224.6 | 206.0 | 209.7 | 206.1 | 214.7 | 208.7 | 211.4 | 207.9 | 201.1 | 201.9 | 206.2 |
| 2003 | 184.6 | 167.0 | 168.7 | 187.1 | 209.5 | 202.9 | 210.3 | 199.6 | 197.4 | 204.5 | 200.4 | 210.8 |
| 2004 | 173.2 | 176.0 | 173.7 | 176.3 | 176.3 | 181.8 | 174.7 | 179.5 | 176.1 | 158.8 | 175.8 | 184.6 |
| 2005 | 150.5 | 168.7 | 160.6 | 152.2 | 183.8 | 163.3 | 164.1 | 152.7 | 137.2 | 138.8 | 153.1 | 151.0 |
| 2006 | 129.8 | 159.3 | 154.8 | 154.0 | 147.0 | 138.6 | 133.5 | 142.2 | 149.2 | 167.9 | 160.5 | 156.0 |
| 2007 | 148.4 | 152.8 | 153.8 | 137.0 | 158.7 | 171.1 | 163.6 | 183.3 | 171.0 | 175.9 | 157.8 | 151.4 |
| 2008 | 152.3 | 146.9 | 143.5 | 138.2 | 138.3 | 133.7 | 141.3 | 149.2 | 142.3 | 143.4 | 151.0 | 135.8 |
| 2009 | 145.7 | 135.4 | 134.6 | 139.4 | 145.6 | 155.6 | 151.4 | 147.7 | 164.1 | 146.5 | 143.1 | 147.5 |
| 2010 | 124.4 | 133.7 | 139.2 | 147.5 | 116.9 | 122.8 | 124.0 | 127.2 | 124.3 | 125.5 | 120.8 | 115.0 |
| 2011 | 99.3 | 104.3 | 105.1 | 103.1 | 110.1 | 116.6 | 109.7 | 120.8 | 119.4 | 118.0 | 117.8 | 116.6 |
| 2012 | 101.0 | 105.3 | 105.3 | 111.0 | 117.8 | 121.8 | 115.8 | 114.3 | 109.0 | 117.9 | 118.6 | 114.0 |
| 2013 | 109.3 | 109.3 | 111.6 | 119.2 | 135.5 | 127.5 | 122.0 | 123.7 | 126.6 | 128.7 | 120.7 | 151.2 |
| 2014 | 145.4 | 148.0 | 151.5 | 155.9 | 171.5 | 162.8 | 165.2 | 161.9 | 166.6 | 174.5 | 182.6 | 192.3 |
| 2015 | 186.9 | 181.7 | 187.3 | 194.5 | 206.7 | 198.6 | 201.6 | 217.6 | 220.4 | 229.6 | 203.8 | 211.2 |
| 2016 | 199.6 | 206.1 | 209.8 | 221.4 | 217.9 | 226.1 | 221.8 | 224.3 | 222.7 | 216.5 | 216.8 | 209.1 |
| 2017 | 185.8 | 199.9 | 206.5 | 218.3 | 210.2 | 222.4 | 203.5 | 214.9 | 193.9 | 207.9 | 196.9 | 199.1 |
| 2018 | 179.5 | 188.7 | 193.1 | 196.0 | 212.8 | 218.9 | 207.2 | 216.7 | 220.8 | 221.6 | 299.7 | 288.3 |
| 2019 | 267.4 | 205.1 | 205.5 | 219.3 | 222.0 | 217.4 | 206.9 | 217.1 | 218.7 | 224.3 | 222.6 | 229.1 |
| 2020 | 216.9 | 231.6 | 199.1 | 145.0 | 212.5 | 251.2 | 243.6 | 245.8 | 250.2 | 251.1 | 238.4 | 231.6 |
| 2021 | 207.9 | 210.4 | 224.6 | 265.9 | 257.7 | 258.8 | 259.5 | 260.1 | 269.0 | 254.5 | 245.9 | W |
| 2022 | 209.5 | 202.5 | W | |||||||||
| - = No Data Reported; -- = Not Applicable; NA = Not Available; W = Withheld to avoid disclosure of individual company data. |
| Release Date: 5/19/2022 |
| Next Release Date: TBD |