|
Download Data (XLS File) |
|
||||||||
|
||||||||
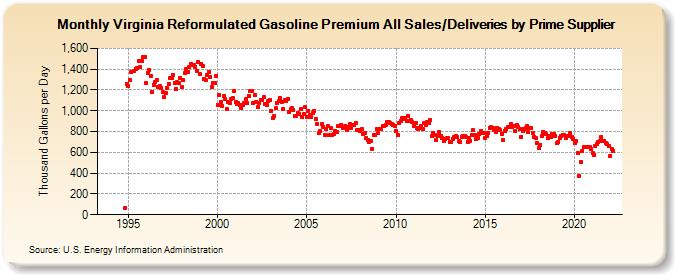
| Virginia Reformulated Gasoline Premium All Sales/Deliveries by Prime Supplier (Thousand Gallons per Day) | ||||||||
| Year | Jan | Feb | Mar | Apr | May | Jun | Jul | Aug | Sep | Oct | Nov | Dec |
|---|---|---|---|---|---|---|---|---|---|---|---|---|
| 1993 | - | - | - | |||||||||
| 1994 | - | - | - | - | - | - | - | - | - | - | 68.2 | 1,260.6 |
| 1995 | 1,237.4 | 1,294.1 | 1,376.5 | W | 1,377.7 | 1,405.3 | 1,413.7 | 1,478.8 | 1,422.6 | 1,479.4 | 1,518.2 | 1,513.6 |
| 1996 | 1,268.2 | 1,365.4 | 1,390.0 | 1,336.6 | 1,181.2 | 1,250.6 | 1,274.0 | 1,293.7 | 1,227.2 | 1,238.1 | 1,214.7 | 1,179.9 |
| 1997 | 1,129.3 | 1,169.6 | 1,217.1 | 1,260.6 | 1,312.2 | 1,316.0 | 1,345.0 | 1,266.6 | 1,213.4 | 1,273.0 | 1,268.5 | 1,318.4 |
| 1998 | 1,229.0 | 1,291.8 | 1,361.5 | 1,402.1 | 1,373.9 | 1,418.5 | 1,446.3 | 1,439.9 | 1,436.5 | 1,423.5 | 1,385.4 | 1,469.7 |
| 1999 | 1,349.9 | 1,454.1 | 1,432.4 | 1,307.9 | 1,297.1 | 1,341.0 | 1,374.0 | 1,328.3 | 1,224.8 | 1,269.7 | 1,271.0 | 1,332.6 |
| 2000 | 1,057.5 | 1,152.3 | 1,085.5 | 1,050.3 | 1,139.9 | 1,110.2 | 1,016.8 | 1,083.6 | 1,077.8 | 1,114.6 | 1,120.7 | 1,187.7 |
| 2001 | 1,082.5 | 1,060.3 | 1,075.0 | 1,053.9 | 1,022.4 | 1,055.4 | 1,077.4 | 1,110.4 | 1,070.8 | 1,142.5 | 1,191.9 | 1,190.1 |
| 2002 | 1,072.0 | 1,147.5 | 1,086.7 | 1,033.0 | 1,076.5 | 1,106.0 | 1,103.6 | 1,130.9 | 1,065.5 | 1,054.0 | 1,097.9 | 1,101.9 |
| 2003 | 1,000.1 | 925.6 | 946.2 | 1,023.1 | 1,079.3 | 1,092.6 | 1,121.6 | 1,088.1 | 1,016.8 | 1,098.8 | 1,097.8 | 1,110.7 |
| 2004 | 987.3 | 1,016.2 | 1,025.2 | 1,005.5 | 947.5 | 953.2 | 980.7 | 972.5 | 1,017.0 | 943.2 | 971.0 | 1,038.1 |
| 2005 | 940.6 | 1,001.4 | 959.5 | 942.7 | 978.5 | 1,002.3 | 925.3 | 873.9 | 783.6 | 801.5 | 873.5 | 848.0 |
| 2006 | 767.4 | 822.4 | 851.5 | 765.1 | 830.5 | 767.6 | 776.3 | 807.3 | 797.6 | 853.0 | 858.0 | 867.6 |
| 2007 | 832.7 | 848.6 | 854.2 | 815.9 | 842.6 | 873.5 | 833.5 | 861.3 | 862.7 | 886.9 | 815.6 | 815.5 |
| 2008 | 806.8 | 823.7 | 780.9 | 788.6 | 740.4 | 722.5 | 703.1 | 713.2 | 635.0 | 762.7 | 762.4 | 825.6 |
| 2009 | 786.1 | 822.1 | 822.6 | 850.6 | 854.7 | 862.9 | 889.5 | 887.8 | 884.3 | 872.1 | 861.9 | 855.7 |
| 2010 | 801.5 | 762.4 | 884.6 | 903.1 | 928.4 | 923.8 | 930.2 | 897.4 | 950.9 | 906.1 | 915.4 | 888.5 |
| 2011 | 858.1 | 878.0 | 837.0 | 821.8 | 832.4 | 852.8 | 820.9 | 879.4 | 860.5 | 888.1 | 886.8 | 911.9 |
| 2012 | 752.9 | 786.5 | 768.9 | 717.5 | 756.4 | 793.9 | 757.9 | 737.5 | 712.3 | 730.5 | 733.3 | 737.2 |
| 2013 | 698.6 | 703.1 | 728.6 | 751.2 | 757.2 | 744.9 | 712.7 | 701.5 | 751.4 | 757.9 | 754.3 | 752.2 |
| 2014 | 701.9 | 742.6 | 712.8 | 768.5 | 810.6 | 767.8 | 729.7 | 740.4 | 771.9 | 803.0 | 786.3 | 787.8 |
| 2015 | 742.3 | 759.3 | 785.2 | 835.4 | 839.5 | 837.2 | 819.6 | 798.1 | 833.7 | 823.8 | 810.4 | 780.7 |
| 2016 | 719.8 | 810.0 | 823.7 | 842.7 | 842.9 | 869.9 | 846.3 | 857.0 | 803.0 | 861.7 | 848.4 | 825.2 |
| 2017 | 750.2 | 804.1 | 826.5 | 838.1 | 851.3 | 792.8 | 830.6 | 830.9 | 789.6 | 752.4 | 739.3 | 690.2 |
| 2018 | 639.8 | 675.3 | 761.0 | 799.2 | 785.8 | 775.1 | 734.7 | 752.6 | 752.2 | 774.9 | 778.6 | 758.7 |
| 2019 | 685.4 | 701.8 | 742.4 | 755.4 | 768.5 | 763.2 | 738.8 | 759.3 | 758.6 | 783.5 | 748.7 | 730.2 |
| 2020 | 694.3 | 707.5 | 595.3 | 376.9 | 510.3 | 617.7 | 649.6 | 650.9 | 652.2 | 648.2 | 651.5 | 630.4 |
| 2021 | 594.1 | 578.8 | 656.8 | 678.3 | 702.5 | 705.0 | 751.4 | 710.6 | 711.2 | 687.7 | 678.6 | 657.6 |
| 2022 | 564.5 | 636.7 | 608.9 | |||||||||
| - = No Data Reported; -- = Not Applicable; NA = Not Available; W = Withheld to avoid disclosure of individual company data. |
| Release Date: 5/19/2022 |
| Next Release Date: TBD |