|
Download Data (XLS File) |
|
||||||||
|
||||||||
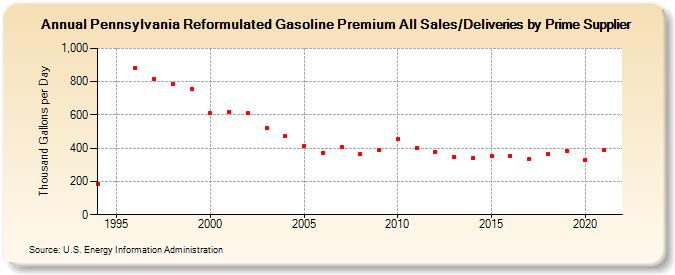
| Pennsylvania Reformulated Gasoline Premium All Sales/Deliveries by Prime Supplier (Thousand Gallons per Day) | ||||||||
| Decade | Year-0 | Year-1 | Year-2 | Year-3 | Year-4 | Year-5 | Year-6 | Year-7 | Year-8 | Year-9 |
|---|---|---|---|---|---|---|---|---|---|---|
| 1990's | 182.9 | W | 884.3 | 817.5 | 788.1 | 754.8 | ||||
| 2000's | 611.0 | 616.1 | 613.7 | 520.6 | 473.8 | 414.4 | 371.9 | 405.5 | 365.8 | 388.6 |
| 2010's | 457.8 | 401.1 | 378.8 | 349.1 | 338.5 | 351.7 | 352.7 | 333.7 | 362.6 | 385.1 |
| 2020's | 331.0 |
| - = No Data Reported; -- = Not Applicable; NA = Not Available; W = Withheld to avoid disclosure of individual company data. |
| Release Date: 6/1/2022 |
| Next Release Date: TBD |