|
Download Data (XLS File) |
|
||||||||
|
||||||||
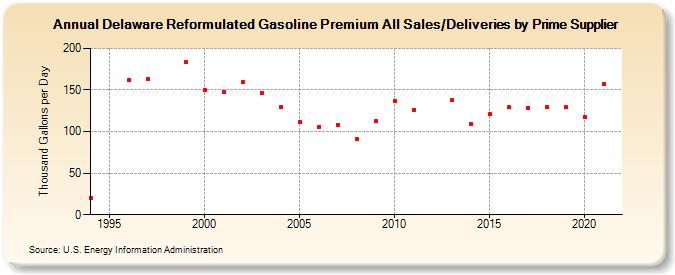
| Delaware Reformulated Gasoline Premium All Sales/Deliveries by Prime Supplier (Thousand Gallons per Day) | ||||||||
| Decade | Year-0 | Year-1 | Year-2 | Year-3 | Year-4 | Year-5 | Year-6 | Year-7 | Year-8 | Year-9 |
|---|---|---|---|---|---|---|---|---|---|---|
| 1990's | 19.5 | W | 161.4 | 163.2 | W | 183.4 | ||||
| 2000's | 149.8 | 147.4 | 159.6 | 146.8 | 129.2 | 111.8 | 105.9 | 107.9 | 90.5 | 112.6 |
| 2010's | 136.6 | 126.4 | W | 137.7 | 108.7 | 121.0 | 129.1 | 128.1 | 129.7 | 129.1 |
| 2020's | 116.9 |
| - = No Data Reported; -- = Not Applicable; NA = Not Available; W = Withheld to avoid disclosure of individual company data. |
| Release Date: 6/1/2022 |
| Next Release Date: TBD |