|
Download Data (XLS File) |
|
||||||||
|
||||||||
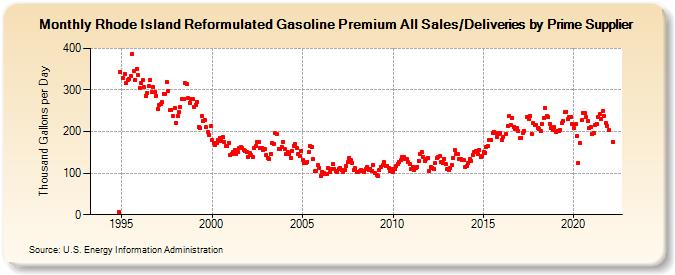
| Rhode Island Reformulated Gasoline Premium All Sales/Deliveries by Prime Supplier (Thousand Gallons per Day) | ||||||||
| Year | Jan | Feb | Mar | Apr | May | Jun | Jul | Aug | Sep | Oct | Nov | Dec |
|---|---|---|---|---|---|---|---|---|---|---|---|---|
| 1993 | - | - | - | |||||||||
| 1994 | - | - | - | - | - | - | - | - | - | - | 6.5 | 342.8 |
| 1995 | W | 328.6 | 338.5 | 316.0 | 323.2 | 327.0 | 333.6 | 387.4 | 345.0 | 324.1 | 351.6 | 335.9 |
| 1996 | 304.4 | 316.7 | 323.2 | 306.9 | 285.9 | 292.4 | 309.7 | 324.5 | 294.2 | 306.9 | 294.0 | 286.7 |
| 1997 | 253.7 | 264.8 | 266.2 | 270.4 | 291.5 | 291.0 | 319.1 | 298.7 | 250.9 | 252.4 | 236.5 | 257.0 |
| 1998 | 220.0 | 237.1 | 247.4 | 259.2 | 278.2 | 277.4 | 316.5 | 314.3 | 279.6 | 269.4 | 277.5 | 278.6 |
| 1999 | 259.6 | 264.7 | 270.4 | 211.7 | 207.7 | 237.1 | 225.5 | 227.2 | 210.0 | 200.1 | 192.4 | 212.4 |
| 2000 | 179.5 | 173.0 | 168.3 | 172.3 | 180.6 | 184.3 | 178.4 | 186.0 | 174.7 | 164.9 | 164.9 | 173.1 |
| 2001 | 143.3 | 146.9 | 149.7 | 156.8 | 147.2 | 150.4 | 159.5 | 163.4 | 160.3 | 156.2 | 154.0 | 150.1 |
| 2002 | 139.1 | 147.6 | 143.6 | 139.8 | 161.5 | 164.1 | 174.6 | 174.2 | 159.9 | 160.5 | 154.5 | 157.3 |
| 2003 | 142.5 | 136.3 | 134.8 | 147.1 | 172.5 | 171.2 | 196.3 | 194.8 | 159.2 | 158.8 | 164.0 | 175.3 |
| 2004 | 159.2 | 144.9 | 150.9 | 145.8 | 136.8 | 154.1 | 166.0 | 170.8 | 159.4 | 146.1 | 141.9 | 152.3 |
| 2005 | 131.6 | 124.2 | 125.5 | 127.9 | 150.3 | 164.1 | 162.2 | 134.2 | 104.2 | 106.2 | 118.6 | 113.1 |
| 2006 | 92.7 | 103.4 | 101.2 | 97.5 | 97.7 | 112.2 | 103.5 | 111.1 | 122.5 | 110.3 | 106.3 | 103.5 |
| 2007 | 110.9 | 112.6 | 106.8 | 101.8 | 108.1 | 117.0 | 126.7 | 137.0 | 130.6 | 125.1 | 107.8 | 111.7 |
| 2008 | 102.4 | 101.9 | 105.3 | 108.4 | 104.7 | 101.9 | 108.8 | 115.8 | 107.5 | 110.7 | 105.9 | 120.4 |
| 2009 | 100.2 | 96.6 | 93.6 | 107.9 | 115.6 | 119.5 | 125.8 | 117.1 | 117.3 | 112.5 | 105.9 | 111.0 |
| 2010 | 103.4 | 110.4 | 116.3 | 121.5 | 126.4 | 130.8 | 137.8 | 137.8 | 133.1 | 133.7 | 125.9 | 122.0 |
| 2011 | 111.0 | 115.7 | 107.5 | 111.9 | 115.5 | 130.3 | 146.8 | 150.2 | 139.0 | 128.7 | 134.0 | 135.8 |
| 2012 | 104.0 | 114.3 | 112.8 | 110.7 | 124.0 | 136.5 | 139.2 | 140.1 | 126.8 | 124.1 | 134.8 | 121.3 |
| 2013 | 110.6 | 108.1 | 112.2 | 119.2 | 137.2 | 156.0 | 146.4 | 145.1 | 135.1 | 134.9 | 131.5 | 130.4 |
| 2014 | 113.8 | 116.5 | 124.4 | 133.1 | 128.8 | 144.0 | 149.8 | 152.1 | 147.1 | 155.2 | 139.7 | 141.3 |
| 2015 | 151.1 | 149.1 | 163.5 | 165.3 | 178.5 | 180.2 | 197.5 | 199.7 | 196.3 | 186.8 | 194.4 | 195.5 |
| 2016 | 179.1 | 186.8 | NA | 193.8 | 214.4 | 236.5 | 216.2 | 233.3 | 212.0 | 205.1 | 209.6 | 201.0 |
| 2017 | 184.3 | 184.2 | 196.7 | 202.3 | NA | 236.1 | 230.9 | 236.8 | 195.2 | 219.9 | 214.9 | 215.5 |
| 2018 | 208.5 | 206.0 | 200.7 | 219.0 | 233.7 | 255.8 | 237.8 | 233.9 | 218.1 | 207.4 | 204.6 | 210.6 |
| 2019 | 198.6 | 202.5 | 200.2 | 204.7 | 220.3 | 225.6 | 245.9 | 247.8 | 229.4 | 235.9 | 234.1 | 217.3 |
| 2020 | 207.5 | 217.1 | 188.6 | 125.4 | 172.5 | 227.0 | 245.0 | 244.5 | 233.8 | 225.4 | 208.7 | 210.9 |
| 2021 | 193.6 | 197.5 | 215.7 | 219.1 | 234.8 | 242.8 | 230.9 | 248.4 | 238.1 | 221.5 | 213.7 | 203.7 |
| 2022 | W | W | 174.7 | |||||||||
| - = No Data Reported; -- = Not Applicable; NA = Not Available; W = Withheld to avoid disclosure of individual company data. |
| Release Date: 5/19/2022 |
| Next Release Date: TBD |