|
Download Data (XLS File) |
|
||||||||
|
||||||||
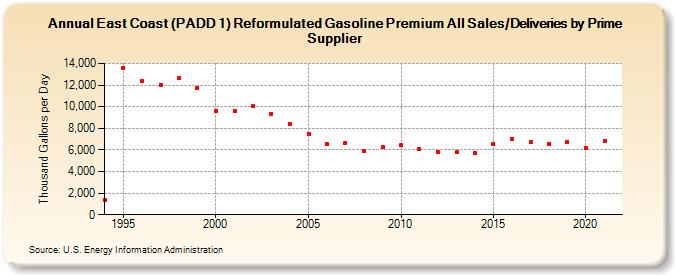
| East Coast (PADD 1) Reformulated Gasoline Premium All Sales/Deliveries by Prime Supplier (Thousand Gallons per Day) | ||||||||
| Decade | Year-0 | Year-1 | Year-2 | Year-3 | Year-4 | Year-5 | Year-6 | Year-7 | Year-8 | Year-9 |
|---|---|---|---|---|---|---|---|---|---|---|
| 1990's | 1,354.4 | 13,623.0 | 12,408.8 | 12,027.7 | 12,643.7 | 11,715.5 | ||||
| 2000's | 9,589.3 | 9,588.7 | 10,042.2 | 9,343.4 | 8,385.3 | 7,505.4 | 6,543.8 | 6,614.4 | 5,929.7 | 6,236.6 |
| 2010's | 6,446.9 | 6,045.4 | 5,830.5 | 5,812.2 | 5,716.3 | 6,548.7 | 6,994.0 | 6,687.4 | 6,575.7 | 6,734.9 |
| 2020's | 6,176.3 |
| - = No Data Reported; -- = Not Applicable; NA = Not Available; W = Withheld to avoid disclosure of individual company data. |
| Release Date: 6/1/2022 |
| Next Release Date: TBD |