|
Download Data (XLS File) |
|
||||||||
|
||||||||
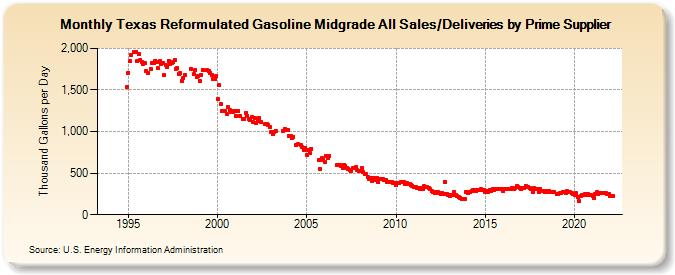
| Texas Reformulated Gasoline Midgrade All Sales/Deliveries by Prime Supplier (Thousand Gallons per Day) | ||||||||
| Year | Jan | Feb | Mar | Apr | May | Jun | Jul | Aug | Sep | Oct | Nov | Dec |
|---|---|---|---|---|---|---|---|---|---|---|---|---|
| 1993 | - | - | - | |||||||||
| 1994 | - | - | - | - | - | - | - | - | - | - | W | 1,532.2 |
| 1995 | 1,709.0 | 1,844.3 | 1,920.7 | W | 1,960.5 | 1,954.4 | 1,853.0 | 1,936.6 | 1,861.9 | 1,841.8 | 1,812.7 | 1,819.0 |
| 1996 | 1,722.7 | 1,706.3 | W | 1,756.6 | 1,819.1 | 1,825.5 | 1,852.7 | 1,836.6 | 1,761.0 | 1,843.8 | 1,818.2 | 1,827.9 |
| 1997 | 1,677.8 | 1,799.4 | 1,781.9 | 1,851.2 | 1,810.9 | 1,829.5 | 1,834.1 | 1,862.2 | 1,752.6 | 1,762.1 | 1,697.9 | 1,699.7 |
| 1998 | 1,613.5 | 1,647.3 | 1,682.7 | W | W | W | 1,753.4 | W | 1,688.1 | 1,740.4 | 1,658.8 | 1,672.3 |
| 1999 | 1,606.5 | 1,684.8 | 1,738.6 | W | W | 1,738.1 | 1,723.4 | 1,708.7 | 1,679.8 | 1,633.0 | 1,627.7 | 1,663.2 |
| 2000 | 1,388.6 | 1,555.6 | 1,326.5 | 1,245.9 | W | 1,248.1 | 1,212.7 | 1,293.2 | 1,259.9 | 1,237.2 | 1,233.9 | 1,251.4 |
| 2001 | 1,181.7 | 1,251.0 | 1,249.1 | 1,187.5 | W | 1,152.6 | 1,155.1 | 1,226.3 | 1,191.0 | 1,147.5 | 1,139.9 | 1,175.7 |
| 2002 | 1,109.4 | 1,162.0 | 1,097.5 | 1,123.1 | 1,161.5 | 1,115.6 | W | W | 1,091.8 | 1,092.1 | 1,079.6 | 1,053.7 |
| 2003 | 993.7 | 968.1 | 993.2 | 1,012.0 | W | W | W | W | 1,011.4 | 1,035.2 | 1,021.8 | 1,017.0 |
| 2004 | 950.8 | 950.3 | 921.9 | 935.3 | W | 836.7 | 846.6 | W | 833.6 | 809.9 | 775.7 | 803.2 |
| 2005 | 723.3 | 774.5 | 741.9 | 794.7 | W | W | W | W | 655.0 | 546.6 | 678.4 | 663.1 |
| 2006 | 635.7 | 711.3 | 685.5 | 704.9 | W | W | W | W | 594.1 | 593.9 | 601.7 | 589.0 |
| 2007 | 567.1 | 603.1 | 590.5 | 562.8 | 555.0 | 543.6 | 530.7 | 560.9 | 555.8 | 568.7 | 532.5 | 524.2 |
| 2008 | 527.2 | 565.3 | 512.1 | 488.9 | 486.1 | 456.0 | 429.0 | 438.6 | 403.5 | 442.5 | 415.9 | 440.2 |
| 2009 | 395.5 | 425.3 | 426.5 | 426.9 | 413.5 | 412.1 | 394.3 | 393.6 | 391.3 | 390.4 | 386.6 | 382.5 |
| 2010 | 362.6 | 383.1 | 376.4 | 388.5 | 390.0 | 392.0 | 369.3 | 386.7 | 373.7 | 366.7 | 360.9 | 348.7 |
| 2011 | 331.7 | 328.5 | 325.9 | 321.4 | 314.9 | 325.3 | 314.9 | 339.8 | 336.3 | 331.5 | 326.5 | 304.5 |
| 2012 | 281.0 | 271.1 | 266.0 | 272.6 | 273.4 | 264.9 | 247.5 | 263.8 | 253.0 | 394.6 | 247.7 | 239.9 |
| 2013 | 229.7 | 239.3 | 237.5 | 274.5 | 238.6 | 221.5 | 208.7 | 203.4 | 194.9 | 194.7 | 192.1 | 274.3 |
| 2014 | 264.1 | 275.3 | 272.3 | 288.6 | 301.8 | 292.3 | 287.1 | 295.8 | 293.0 | 303.7 | 298.4 | 298.0 |
| 2015 | 272.3 | 279.5 | 279.0 | 300.9 | 290.9 | 307.9 | 299.5 | 309.3 | 308.0 | 308.6 | 305.0 | 303.4 |
| 2016 | 284.5 | 303.4 | 310.5 | 308.7 | 312.1 | 310.2 | 316.2 | 313.5 | 322.2 | 344.0 | 333.8 | 321.1 |
| 2017 | 306.1 | 321.4 | 326.3 | 350.1 | 335.6 | 331.0 | 318.2 | 310.5 | 272.4 | 320.8 | 313.7 | 306.0 |
| 2018 | 278.1 | 307.5 | 286.2 | 290.2 | 274.7 | 281.0 | 267.2 | 283.8 | 268.4 | 270.4 | 273.5 | W |
| 2019 | 243.5 | 250.5 | 255.9 | 264.1 | 273.7 | 269.1 | 265.5 | 280.5 | 270.4 | 268.2 | 257.8 | 248.8 |
| 2020 | 242.5 | 256.3 | 217.7 | 166.9 | 224.4 | 241.6 | 237.8 | 246.4 | 240.2 | 247.9 | 239.6 | 234.4 |
| 2021 | 229.8 | 205.4 | 252.4 | 273.0 | 254.0 | 264.2 | 266.6 | 266.3 | 262.8 | 256.7 | 244.6 | 243.5 |
| 2022 | 228.7 | 221.2 | 222.6 | |||||||||
| - = No Data Reported; -- = Not Applicable; NA = Not Available; W = Withheld to avoid disclosure of individual company data. |
| Release Date: 5/19/2022 |
| Next Release Date: TBD |