|
Download Data (XLS File) |
|
||||||||
|
||||||||
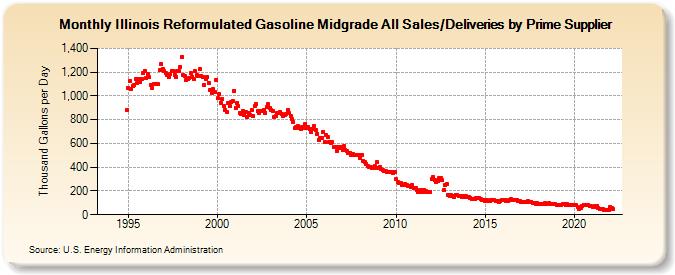
| Illinois Reformulated Gasoline Midgrade All Sales/Deliveries by Prime Supplier (Thousand Gallons per Day) | ||||||||
| Year | Jan | Feb | Mar | Apr | May | Jun | Jul | Aug | Sep | Oct | Nov | Dec |
|---|---|---|---|---|---|---|---|---|---|---|---|---|
| 1993 | - | - | - | |||||||||
| 1994 | - | - | - | - | - | - | - | - | - | - | W | 880.7 |
| 1995 | 1,068.2 | 1,127.2 | 1,061.9 | 1,086.2 | 1,091.7 | 1,144.2 | 1,112.8 | 1,140.9 | 1,119.2 | 1,142.3 | 1,192.7 | 1,211.6 |
| 1996 | 1,149.7 | 1,188.4 | 1,156.5 | 1,093.8 | 1,064.9 | 1,097.0 | 1,099.4 | 1,097.7 | 1,098.9 | 1,215.3 | 1,270.1 | 1,226.8 |
| 1997 | 1,207.0 | 1,189.9 | 1,180.0 | 1,158.2 | 1,181.7 | 1,212.7 | 1,211.3 | 1,178.2 | 1,155.6 | 1,211.1 | 1,209.3 | 1,244.1 |
| 1998 | 1,329.7 | 1,173.4 | 1,165.5 | 1,132.4 | 1,143.3 | 1,150.3 | 1,192.0 | 1,161.1 | 1,142.4 | 1,206.0 | 1,173.9 | 1,164.5 |
| 1999 | 1,223.2 | 1,165.1 | 1,162.3 | 1,093.5 | 1,143.2 | 1,161.2 | 1,109.4 | 1,050.3 | 1,024.1 | 1,056.4 | 1,033.0 | 1,136.5 |
| 2000 | 979.8 | 1,018.0 | 943.0 | 974.0 | 918.7 | 883.1 | 863.9 | 937.2 | 916.2 | 947.7 | 960.0 | 1,044.6 |
| 2001 | 899.3 | 941.8 | 913.4 | 855.2 | 847.9 | 868.8 | 840.1 | 862.5 | 819.9 | 856.1 | 843.0 | 877.7 |
| 2002 | 830.4 | 918.5 | 928.7 | 870.7 | 859.4 | 872.0 | 874.0 | 881.7 | 858.4 | 903.2 | 928.7 | 899.4 |
| 2003 | 883.7 | 872.4 | 820.8 | 829.2 | 854.2 | 859.7 | 866.0 | 851.5 | 834.1 | 842.5 | 847.7 | 879.7 |
| 2004 | 852.1 | 833.7 | 804.8 | 782.3 | 726.1 | 734.4 | 743.6 | 730.1 | 723.9 | 734.5 | 729.2 | 762.8 |
| 2005 | 726.0 | 737.9 | 719.0 | 694.8 | 722.1 | 746.2 | 713.1 | 682.5 | 631.9 | 642.4 | 648.2 | 700.4 |
| 2006 | 610.1 | 669.6 | 653.5 | 615.5 | 600.5 | 609.6 | 568.1 | 567.6 | 539.6 | 569.7 | 564.6 | 572.7 |
| 2007 | 542.9 | 579.2 | 546.9 | 532.4 | 517.4 | 522.9 | 504.5 | 514.9 | 501.8 | 500.6 | 503.7 | 499.7 |
| 2008 | 479.2 | 503.3 | 454.1 | 440.1 | 426.1 | 410.9 | 405.4 | 402.3 | 394.8 | 391.7 | 407.7 | 441.3 |
| 2009 | 397.0 | 405.0 | 382.5 | 372.9 | 366.0 | 364.9 | 359.5 | 356.6 | 356.1 | 361.3 | 348.8 | 360.7 |
| 2010 | 297.6 | 277.8 | 269.5 | 270.6 | 252.9 | 252.3 | 261.1 | 254.2 | 245.2 | 240.3 | 235.9 | 246.4 |
| 2011 | 223.3 | 227.6 | 209.5 | 191.5 | 191.3 | 204.2 | 194.6 | 204.6 | 197.3 | 194.7 | 195.4 | 194.5 |
| 2012 | 303.7 | 318.1 | 290.2 | 273.4 | 283.9 | 305.2 | 305.6 | 288.5 | 209.2 | 249.3 | 254.9 | 164.9 |
| 2013 | 160.3 | 163.7 | 156.5 | 152.5 | 169.2 | 163.3 | 156.2 | 159.2 | 152.4 | 155.0 | 152.6 | 155.3 |
| 2014 | 151.4 | 149.9 | 144.1 | 133.2 | 136.0 | 133.5 | 138.7 | 142.8 | 139.5 | 128.2 | 126.3 | 126.6 |
| 2015 | 118.2 | 124.6 | 118.7 | 115.0 | 120.6 | 120.3 | 124.9 | 114.8 | 112.7 | 110.6 | 113.2 | 120.4 |
| 2016 | 120.2 | 124.9 | 118.5 | 118.7 | 125.0 | 130.6 | 125.7 | 127.2 | 127.5 | 120.4 | 113.6 | 116.5 |
| 2017 | 104.3 | 104.9 | 106.6 | 103.2 | 108.1 | 112.2 | 104.7 | 110.6 | 100.3 | 96.0 | 89.9 | 94.8 |
| 2018 | 87.7 | 91.0 | 92.2 | 91.1 | 96.2 | 92.8 | 92.2 | 94.5 | 90.9 | 92.1 | 89.7 | 86.2 |
| 2019 | 79.9 | 79.5 | 79.4 | 83.1 | 86.4 | 92.4 | 83.3 | 88.0 | 82.5 | 84.7 | 84.1 | 81.9 |
| 2020 | 79.1 | 79.7 | 67.2 | 51.0 | 58.8 | 76.3 | 84.1 | 81.9 | 79.3 | 77.9 | 70.6 | 69.4 |
| 2021 | 66.5 | 67.8 | 69.8 | 75.4 | 59.7 | 46.9 | 45.1 | 44.6 | 43.1 | 37.0 | 38.0 | 35.7 |
| 2022 | 63.1 | 53.1 | 44.5 | |||||||||
| - = No Data Reported; -- = Not Applicable; NA = Not Available; W = Withheld to avoid disclosure of individual company data. |
| Release Date: 5/19/2022 |
| Next Release Date: TBD |