|
Download Data (XLS File) |
|
||||||||
|
||||||||
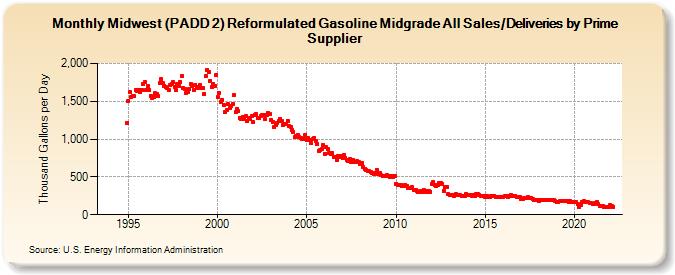
| Midwest (PADD 2) Reformulated Gasoline Midgrade All Sales/Deliveries by Prime Supplier (Thousand Gallons per Day) | ||||||||
| Year | Jan | Feb | Mar | Apr | May | Jun | Jul | Aug | Sep | Oct | Nov | Dec |
|---|---|---|---|---|---|---|---|---|---|---|---|---|
| 1993 | - | - | - | |||||||||
| 1994 | - | - | - | - | - | - | - | - | - | - | W | 1,214.9 |
| 1995 | 1,510.3 | 1,618.8 | 1,560.4 | 1,567.4 | 1,565.7 | 1,649.3 | 1,636.1 | 1,655.3 | 1,623.3 | 1,652.7 | 1,727.1 | 1,752.5 |
| 1996 | 1,651.9 | 1,701.6 | 1,655.0 | 1,570.8 | 1,542.0 | 1,561.5 | 1,606.0 | 1,597.3 | 1,569.8 | 1,741.5 | 1,793.0 | 1,740.9 |
| 1997 | 1,706.9 | 1,684.3 | 1,680.4 | 1,651.2 | 1,709.5 | 1,730.1 | 1,751.5 | 1,695.2 | 1,647.9 | 1,727.4 | 1,706.9 | 1,753.9 |
| 1998 | 1,836.1 | 1,669.2 | 1,665.5 | 1,613.8 | 1,626.5 | 1,656.0 | 1,734.9 | 1,696.9 | 1,653.1 | 1,717.1 | 1,672.4 | 1,682.5 |
| 1999 | 1,716.7 | 1,681.5 | 1,671.4 | 1,600.5 | 1,833.6 | 1,919.6 | 1,886.7 | 1,774.4 | 1,688.0 | 1,728.2 | 1,703.5 | 1,847.3 |
| 2000 | 1,556.1 | 1,613.9 | 1,496.8 | 1,522.5 | 1,457.4 | 1,352.1 | 1,378.3 | 1,458.4 | 1,405.7 | 1,436.0 | 1,464.0 | 1,580.1 |
| 2001 | 1,356.8 | 1,398.3 | 1,370.2 | 1,284.3 | 1,261.7 | 1,294.0 | 1,269.9 | 1,302.8 | 1,243.7 | 1,284.4 | 1,261.7 | 1,301.8 |
| 2002 | 1,221.6 | 1,317.8 | 1,327.7 | 1,283.1 | 1,282.2 | 1,303.7 | 1,313.6 | 1,315.9 | 1,262.5 | 1,312.6 | 1,351.2 | 1,327.2 |
| 2003 | 1,255.5 | 1,223.9 | 1,156.6 | 1,182.9 | 1,215.5 | 1,237.1 | 1,264.0 | 1,234.9 | 1,188.3 | 1,198.6 | 1,199.0 | 1,242.9 |
| 2004 | 1,176.0 | 1,155.1 | 1,124.5 | 1,091.9 | 1,021.7 | 1,040.3 | 1,054.5 | 1,031.9 | 1,015.8 | 1,001.7 | 1,007.1 | 1,060.5 |
| 2005 | 982.3 | 1,016.2 | 989.5 | 943.2 | 996.8 | 1,013.3 | 977.4 | 936.7 | 847.7 | 851.7 | 870.9 | 925.2 |
| 2006 | 807.1 | 890.1 | 864.1 | 812.9 | 804.4 | 815.5 | 767.3 | 768.4 | 729.7 | 776.0 | 766.7 | 781.6 |
| 2007 | 744.7 | 793.1 | 753.7 | 720.5 | 710.7 | 742.1 | 691.7 | 723.6 | 698.0 | 699.2 | 710.2 | 694.6 |
| 2008 | 671.3 | 688.2 | 633.6 | 610.9 | 594.0 | 580.8 | 572.1 | 559.9 | 551.7 | 543.6 | 557.0 | 596.8 |
| 2009 | 536.2 | 550.0 | 522.4 | 513.5 | 515.5 | 518.0 | 520.0 | 508.5 | 504.4 | 515.6 | 492.4 | 506.7 |
| 2010 | 411.0 | 398.9 | 388.2 | 393.0 | 374.6 | 373.5 | 399.1 | 383.1 | 358.0 | 355.5 | 350.9 | 360.8 |
| 2011 | 325.7 | 331.6 | 312.6 | 297.4 | 295.3 | 308.5 | 303.5 | 321.7 | 309.9 | 303.9 | 307.5 | 305.3 |
| 2012 | 411.5 | 428.3 | 390.7 | 374.5 | 394.2 | 420.9 | 423.8 | 403.7 | 317.4 | 367.0 | 368.2 | 271.7 |
| 2013 | 263.9 | 263.9 | 264.6 | 251.4 | 271.3 | 264.2 | 262.4 | 263.5 | 248.4 | 254.1 | 250.6 | 274.0 |
| 2014 | 262.9 | 266.2 | 257.1 | 246.2 | 258.7 | 251.6 | 268.2 | 273.1 | 266.8 | 244.5 | 248.3 | 251.3 |
| 2015 | 231.3 | 242.7 | 233.3 | 233.3 | 247.1 | 241.8 | 252.9 | 238.6 | 233.5 | 233.0 | 235.5 | 240.6 |
| 2016 | 239.6 | 242.2 | 250.0 | 238.1 | 247.7 | 258.1 | 252.5 | 253.9 | 249.9 | 237.6 | 228.9 | 233.2 |
| 2017 | 214.0 | 211.5 | 218.0 | 218.9 | 220.9 | 229.7 | 215.8 | 221.5 | 204.4 | 199.2 | 191.5 | 199.1 |
| 2018 | 185.7 | 189.6 | 195.4 | 192.4 | 200.9 | 197.9 | 192.9 | 197.5 | 188.2 | 192.9 | 188.0 | 180.5 |
| 2019 | 166.2 | 170.0 | 174.9 | 177.1 | 180.1 | 186.2 | 177.2 | 184.1 | 174.6 | 176.2 | 174.1 | 171.1 |
| 2020 | 164.3 | 167.4 | 140.0 | 107.5 | 132.1 | 168.0 | 177.8 | 174.5 | 167.2 | 166.0 | 152.0 | 153.2 |
| 2021 | 145.4 | 147.5 | 157.0 | 166.9 | 139.8 | 117.5 | 116.3 | 113.5 | 108.3 | 99.6 | 100.7 | 96.8 |
| 2022 | 125.9 | 114.1 | 102.4 | |||||||||
| - = No Data Reported; -- = Not Applicable; NA = Not Available; W = Withheld to avoid disclosure of individual company data. |
| Release Date: 5/19/2022 |
| Next Release Date: TBD |