|
Download Data (XLS File) |
|
||||||||
|
||||||||
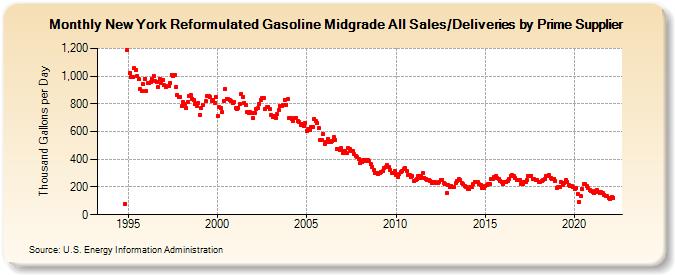
| New York Reformulated Gasoline Midgrade All Sales/Deliveries by Prime Supplier (Thousand Gallons per Day) | ||||||||
| Year | Jan | Feb | Mar | Apr | May | Jun | Jul | Aug | Sep | Oct | Nov | Dec |
|---|---|---|---|---|---|---|---|---|---|---|---|---|
| 1993 | - | - | - | |||||||||
| 1994 | - | - | - | - | - | - | - | - | - | - | 76.7 | 1,185.8 |
| 1995 | W | 1,022.9 | 992.1 | 993.6 | 1,055.2 | 1,046.9 | 1,000.0 | 976.1 | 905.9 | 893.1 | 940.6 | 978.7 |
| 1996 | 894.9 | 948.0 | 946.8 | 955.2 | 981.1 | 1,002.9 | 961.7 | 956.8 | 923.5 | 981.9 | 952.0 | 969.3 |
| 1997 | 932.8 | 917.9 | 926.0 | 926.0 | 952.1 | 1,010.7 | 1,003.1 | 1,009.3 | 921.5 | 866.6 | 850.5 | 850.7 |
| 1998 | 785.9 | 810.8 | 796.7 | 769.3 | 811.9 | 857.7 | 861.0 | 835.2 | 826.3 | 799.9 | 785.9 | 808.7 |
| 1999 | 721.4 | 771.2 | 790.1 | W | 818.1 | 855.3 | 858.6 | 845.9 | 821.4 | 826.0 | 808.8 | 849.3 |
| 2000 | 713.2 | 773.6 | 770.2 | 739.2 | 821.5 | 908.4 | 831.3 | 832.4 | 824.9 | 821.7 | 803.8 | 813.2 |
| 2001 | 766.8 | 760.4 | 770.9 | 801.7 | 872.3 | 849.5 | 807.8 | 789.0 | 740.7 | 737.0 | 738.9 | 734.0 |
| 2002 | 694.6 | 733.8 | 760.5 | 767.3 | 799.4 | 830.4 | 840.5 | 844.3 | 761.2 | 774.6 | 780.0 | 762.1 |
| 2003 | 719.7 | 706.3 | 715.8 | 701.1 | 723.6 | 753.1 | 785.8 | 785.9 | 793.9 | 829.1 | 794.3 | 831.8 |
| 2004 | 696.7 | 695.4 | 689.4 | 677.0 | 696.4 | 698.7 | 675.4 | 668.2 | 647.3 | 653.0 | 637.9 | 659.3 |
| 2005 | 605.3 | 615.0 | 610.9 | 629.6 | 630.6 | 689.1 | 675.9 | 660.4 | 622.8 | 540.4 | 541.6 | 585.3 |
| 2006 | 511.9 | 525.8 | 546.8 | 525.5 | 522.6 | 533.3 | 557.4 | 542.6 | 475.2 | 476.6 | 465.9 | 478.0 |
| 2007 | 443.8 | 458.7 | 461.1 | 446.4 | 480.9 | 475.0 | 458.2 | 456.3 | 435.9 | 424.9 | 412.9 | 401.2 |
| 2008 | 376.2 | 380.0 | 391.6 | 396.0 | 384.4 | 397.5 | 387.9 | 362.9 | 343.6 | 321.1 | 297.4 | 302.1 |
| 2009 | 296.7 | 301.6 | 304.9 | 317.0 | 336.2 | 343.5 | 356.5 | 347.5 | 322.4 | 303.0 | 304.2 | 314.0 |
| 2010 | 287.8 | 270.4 | 297.2 | 310.2 | 313.3 | 327.2 | 338.3 | 318.7 | 290.1 | 286.1 | 273.6 | 276.6 |
| 2011 | 245.6 | 249.6 | 254.5 | 277.4 | 262.1 | 278.4 | 297.7 | 266.5 | 259.8 | 250.3 | 251.2 | 246.1 |
| 2012 | 225.5 | 235.3 | 236.7 | 228.4 | 225.9 | 237.6 | 253.3 | 252.5 | 229.8 | 220.3 | 153.8 | 213.3 |
| 2013 | 196.4 | 209.5 | 197.5 | 200.7 | 226.5 | 243.7 | 256.3 | 250.3 | 228.0 | 219.3 | 210.0 | 203.0 |
| 2014 | 187.8 | 184.4 | 199.6 | 200.0 | 220.2 | 236.6 | 233.6 | 235.1 | 218.7 | 213.5 | 196.1 | 193.8 |
| 2015 | 204.5 | 212.4 | 218.3 | 219.0 | 254.5 | 259.4 | 275.3 | 278.3 | 264.8 | 260.3 | 244.3 | 238.2 |
| 2016 | 223.9 | 234.4 | 238.0 | 245.3 | 257.6 | 279.9 | 286.0 | 281.5 | 264.0 | 248.9 | 248.9 | 248.2 |
| 2017 | 224.9 | 224.0 | 235.0 | 238.4 | 248.9 | 278.4 | 282.5 | 281.7 | 260.2 | 255.5 | 252.7 | 251.5 |
| 2018 | 232.6 | 237.0 | 244.7 | 247.8 | 256.5 | 279.6 | 282.5 | 284.5 | 263.3 | 256.9 | 257.9 | 244.6 |
| 2019 | 194.5 | 197.2 | 202.3 | 234.7 | 216.0 | 229.5 | 250.1 | 235.1 | 214.3 | 205.2 | 205.1 | 197.3 |
| 2020 | 185.9 | 190.4 | 152.7 | 93.3 | 132.8 | 186.8 | 218.0 | 220.4 | 204.5 | 191.8 | 180.0 | 173.1 |
| 2021 | 164.8 | 157.4 | 173.0 | 181.6 | 165.6 | 154.3 | 161.8 | 154.9 | 144.6 | 138.5 | 132.2 | 123.9 |
| 2022 | 115.5 | 127.8 | 122.1 | |||||||||
| - = No Data Reported; -- = Not Applicable; NA = Not Available; W = Withheld to avoid disclosure of individual company data. |
| Release Date: 5/19/2022 |
| Next Release Date: TBD |