|
Download Data (XLS File) |
|
||||||||
|
||||||||
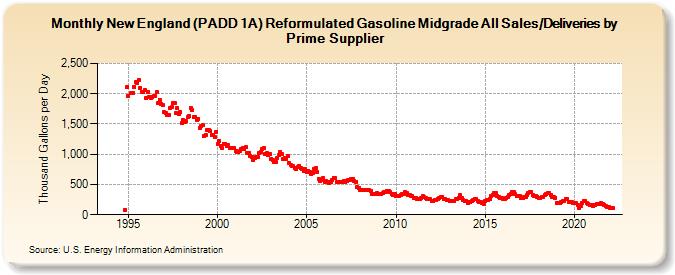
| New England (PADD 1A) Reformulated Gasoline Midgrade All Sales/Deliveries by Prime Supplier (Thousand Gallons per Day) | ||||||||
| Year | Jan | Feb | Mar | Apr | May | Jun | Jul | Aug | Sep | Oct | Nov | Dec |
|---|---|---|---|---|---|---|---|---|---|---|---|---|
| 1993 | - | - | - | |||||||||
| 1994 | - | - | - | - | - | - | - | - | - | - | 81.3 | 2,104.1 |
| 1995 | 1,967.2 | W | 2,016.3 | 2,009.2 | 2,115.4 | 2,195.0 | 2,171.9 | 2,234.7 | 2,100.5 | 2,029.8 | 2,032.4 | 2,062.2 |
| 1996 | 1,921.3 | 2,021.5 | 1,951.6 | 1,924.1 | 1,937.9 | 1,968.4 | 1,965.4 | 2,033.7 | 1,846.7 | 1,901.1 | 1,837.1 | 1,806.5 |
| 1997 | 1,695.9 | 1,686.0 | 1,643.3 | 1,655.9 | 1,770.0 | 1,777.4 | 1,848.5 | 1,853.4 | 1,677.8 | 1,757.1 | 1,657.0 | 1,692.3 |
| 1998 | 1,512.3 | 1,560.5 | 1,526.2 | 1,542.2 | 1,608.4 | 1,633.1 | 1,762.7 | 1,725.2 | 1,615.1 | 1,623.1 | 1,565.8 | 1,583.4 |
| 1999 | 1,435.5 | 1,472.5 | 1,475.2 | 1,301.9 | 1,325.8 | 1,397.5 | 1,400.0 | 1,375.7 | 1,316.0 | 1,319.3 | 1,277.2 | 1,375.0 |
| 2000 | 1,172.4 | 1,218.7 | 1,136.4 | 1,097.3 | 1,174.6 | 1,173.2 | 1,140.6 | 1,154.5 | 1,101.7 | 1,100.5 | 1,098.6 | 1,109.1 |
| 2001 | 1,050.1 | 1,039.7 | 1,033.4 | 1,050.8 | 1,082.1 | 1,100.7 | 1,081.4 | 1,111.8 | 1,023.3 | 1,025.5 | 970.2 | 952.7 |
| 2002 | 900.3 | 941.2 | 961.3 | 948.8 | 1,020.4 | 1,038.6 | 1,087.3 | 1,097.7 | 1,010.9 | 1,018.1 | 985.8 | 1,001.2 |
| 2003 | 926.9 | 903.8 | 879.2 | 877.7 | 943.5 | 981.3 | 1,032.5 | 1,011.8 | 917.8 | 939.8 | 923.2 | 971.2 |
| 2004 | 860.5 | 826.7 | 803.2 | 797.1 | 772.3 | 756.5 | 792.3 | 812.2 | 765.5 | 758.0 | 719.4 | 754.3 |
| 2005 | 698.9 | 723.2 | 706.5 | 668.9 | 690.5 | 763.4 | 765.6 | 702.1 | 596.1 | 557.5 | 573.3 | 603.4 |
| 2006 | 535.5 | 555.4 | 544.4 | 529.7 | 547.5 | 579.6 | 610.6 | 600.7 | 545.6 | 541.7 | 540.6 | 542.7 |
| 2007 | 540.7 | 554.8 | 540.5 | 555.5 | 581.1 | 577.4 | 591.4 | 594.3 | 549.8 | 547.6 | 456.7 | 449.8 |
| 2008 | 412.3 | 415.4 | 413.4 | 408.7 | 414.5 | 412.3 | 402.8 | 389.5 | 350.3 | 348.8 | 339.4 | 357.9 |
| 2009 | 334.4 | 343.0 | 339.3 | 353.1 | 374.5 | 371.9 | 398.8 | 393.1 | 369.7 | 345.0 | 331.2 | 347.2 |
| 2010 | 303.5 | 302.4 | 308.9 | 322.5 | 346.3 | 346.9 | 382.4 | 367.0 | 322.9 | 320.3 | 311.3 | 311.1 |
| 2011 | 276.9 | 279.3 | 263.7 | 263.6 | 255.4 | 269.5 | 303.6 | 285.3 | 272.2 | 262.7 | 260.5 | 255.1 |
| 2012 | 225.0 | 232.8 | 240.9 | 246.4 | 262.2 | 276.7 | 290.9 | 298.1 | 259.2 | 252.5 | 251.4 | 235.1 |
| 2013 | 228.2 | 228.8 | 228.8 | 232.4 | 253.6 | 267.3 | 283.7 | 318.5 | 282.3 | 237.6 | 232.0 | 228.5 |
| 2014 | 198.3 | 206.6 | 213.4 | 226.4 | 242.1 | 264.9 | 254.5 | 227.6 | 207.1 | 202.9 | 188.3 | 185.1 |
| 2015 | 230.9 | 239.1 | 247.7 | 260.1 | 312.4 | 333.7 | 359.9 | 351.4 | 316.9 | 299.1 | 283.4 | 278.3 |
| 2016 | 260.0 | 262.5 | 273.0 | 290.0 | 321.9 | 346.2 | 372.5 | 372.8 | 334.9 | 311.3 | 304.7 | 302.8 |
| 2017 | 276.3 | 279.9 | 290.7 | 295.4 | 320.9 | 354.5 | 378.6 | 372.5 | 323.7 | 307.0 | 302.6 | 299.2 |
| 2018 | 281.9 | 282.5 | 286.9 | 297.9 | 321.8 | 335.4 | 361.3 | 354.4 | 322.1 | 299.5 | 286.2 | 283.1 |
| 2019 | 196.4 | 197.0 | 201.9 | 208.4 | 224.9 | 233.2 | 260.6 | 253.9 | 218.3 | 205.9 | 204.0 | 195.2 |
| 2020 | 187.1 | 187.7 | 152.6 | 105.4 | 143.4 | 199.7 | 230.1 | 230.0 | 199.9 | 181.0 | 163.0 | 160.3 |
| 2021 | 150.9 | 158.8 | 166.1 | 174.3 | 172.7 | 175.2 | 185.7 | 180.7 | 161.1 | 147.4 | 133.3 | 127.4 |
| 2022 | 113.0 | 114.1 | 102.8 | |||||||||
| - = No Data Reported; -- = Not Applicable; NA = Not Available; W = Withheld to avoid disclosure of individual company data. |
| Release Date: 5/19/2022 |
| Next Release Date: TBD |