|
Download Data (XLS File) |
|
||||||||
|
||||||||
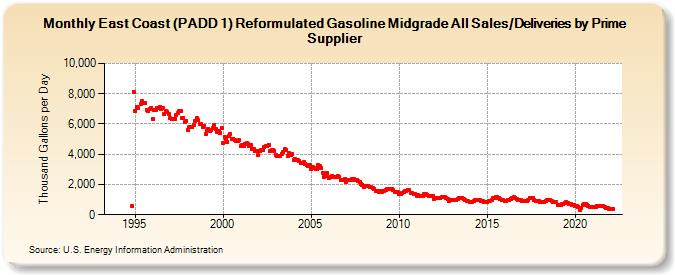
| East Coast (PADD 1) Reformulated Gasoline Midgrade All Sales/Deliveries by Prime Supplier (Thousand Gallons per Day) | ||||||||
| Year | Jan | Feb | Mar | Apr | May | Jun | Jul | Aug | Sep | Oct | Nov | Dec |
|---|---|---|---|---|---|---|---|---|---|---|---|---|
| 1993 | - | - | - | |||||||||
| 1994 | - | - | - | - | - | - | - | - | - | - | 576.5 | 8,114.9 |
| 1995 | 6,843.8 | 7,098.8 | 7,072.6 | W | 7,346.7 | 7,516.6 | 7,354.4 | 7,375.7 | 6,946.4 | 6,880.4 | 6,979.9 | 7,083.7 |
| 1996 | 6,343.0 | 6,891.8 | 6,930.0 | 7,081.5 | 7,027.5 | 7,122.1 | 6,999.6 | 7,033.2 | 6,658.9 | 6,853.6 | 6,812.1 | 6,680.9 |
| 1997 | 6,389.7 | 6,320.6 | 6,299.2 | 6,354.6 | 6,576.2 | 6,725.0 | 6,849.1 | 6,852.4 | 6,364.6 | 6,409.4 | 6,117.5 | 6,220.7 |
| 1998 | 5,634.2 | 5,816.9 | 5,767.5 | 5,806.7 | 5,955.3 | 6,167.3 | 6,392.4 | 6,231.7 | 6,005.5 | 6,004.1 | 5,832.2 | 5,844.7 |
| 1999 | 5,315.4 | 5,569.3 | 5,687.5 | 5,503.5 | 5,569.5 | 5,723.8 | 5,953.9 | 5,660.2 | 5,464.3 | 5,516.0 | 5,404.7 | 5,732.4 |
| 2000 | 4,748.9 | 5,118.4 | 5,036.8 | 4,837.8 | 5,172.5 | 5,339.4 | 5,019.5 | 5,035.0 | 4,922.6 | 4,906.5 | 4,860.3 | 4,913.6 |
| 2001 | 4,527.6 | 4,584.6 | 4,566.3 | 4,690.2 | 4,739.9 | 4,684.8 | 4,550.7 | 4,607.9 | 4,341.0 | 4,327.9 | 4,192.7 | 4,212.6 |
| 2002 | 3,957.1 | 4,192.7 | 4,268.7 | 4,248.2 | 4,448.4 | 4,524.2 | 4,570.1 | 4,637.6 | 4,242.2 | 4,273.2 | 4,259.8 | 4,240.6 |
| 2003 | 3,972.0 | 3,874.6 | 3,865.8 | 3,886.3 | 4,034.4 | 4,133.8 | 4,315.5 | 4,253.0 | 3,914.8 | 4,051.9 | 3,927.5 | 4,027.0 |
| 2004 | 3,632.8 | 3,652.1 | 3,613.9 | 3,590.9 | 3,536.9 | 3,430.0 | 3,452.4 | 3,452.6 | 3,336.7 | 3,299.6 | 3,190.8 | 3,296.6 |
| 2005 | 3,017.9 | 3,139.0 | 3,089.9 | 3,013.4 | 3,051.5 | 3,276.7 | 3,203.4 | 3,077.0 | 2,769.5 | 2,522.8 | 2,576.7 | 2,734.7 |
| 2006 | 2,408.9 | 2,497.8 | 2,532.4 | 2,469.8 | 2,488.0 | 2,514.9 | 2,590.6 | 2,508.0 | 2,294.9 | 2,299.6 | 2,305.8 | 2,345.7 |
| 2007 | 2,193.2 | 2,309.6 | 2,300.0 | 2,272.5 | 2,388.0 | 2,336.1 | 2,317.1 | 2,314.4 | 2,208.3 | 2,187.3 | 2,056.1 | 1,996.0 |
| 2008 | 1,859.8 | 1,884.9 | 1,866.3 | 1,888.0 | 1,841.9 | 1,815.6 | 1,753.5 | 1,679.2 | 1,558.7 | 1,554.0 | 1,481.8 | 1,540.0 |
| 2009 | 1,484.5 | 1,545.0 | 1,541.4 | 1,610.9 | 1,675.0 | 1,687.0 | 1,731.5 | 1,698.5 | 1,603.9 | 1,531.6 | 1,478.0 | 1,532.4 |
| 2010 | 1,394.5 | 1,350.4 | 1,441.5 | 1,491.6 | 1,571.4 | 1,595.2 | 1,649.1 | 1,604.6 | 1,462.7 | 1,423.7 | 1,394.8 | 1,385.5 |
| 2011 | 1,256.7 | 1,284.4 | 1,251.0 | 1,264.9 | 1,256.7 | 1,346.9 | 1,383.4 | 1,330.9 | 1,262.1 | 1,228.5 | 1,217.1 | 1,251.7 |
| 2012 | 1,047.6 | 1,081.4 | 1,100.4 | 1,078.4 | 1,115.6 | 1,162.8 | 1,193.2 | 1,195.2 | 1,093.6 | 1,069.3 | 938.8 | 995.0 |
| 2013 | 966.3 | 952.7 | 958.9 | 964.0 | 1,051.9 | 1,096.1 | 1,122.4 | 1,127.4 | 1,060.7 | 964.1 | 918.9 | 888.2 |
| 2014 | 814.5 | 835.8 | 860.1 | 891.6 | 954.9 | 978.1 | 1,002.6 | 981.5 | 907.9 | 903.1 | 830.9 | 818.1 |
| 2015 | 833.5 | 905.3 | 912.6 | 951.4 | 1,091.3 | 1,117.9 | 1,181.7 | 1,163.8 | 1,075.1 | 1,029.2 | 958.9 | 943.6 |
| 2016 | 883.3 | 891.7 | 942.2 | 984.9 | 1,037.7 | 1,123.8 | 1,150.0 | 1,136.2 | 1,045.8 | 994.6 | 982.1 | 974.6 |
| 2017 | 883.4 | 896.9 | 932.6 | 939.6 | 1,004.8 | 1,098.8 | 1,112.1 | 1,113.2 | 980.8 | 936.5 | 907.3 | 905.9 |
| 2018 | 822.7 | 833.7 | 814.8 | 836.9 | 890.4 | 942.7 | 966.6 | 973.9 | 894.5 | 864.2 | 837.4 | 812.8 |
| 2019 | 620.6 | 631.5 | 646.5 | 692.9 | 727.5 | 755.1 | 824.9 | 799.8 | 708.8 | 679.6 | 666.5 | 633.3 |
| 2020 | 598.3 | 608.7 | 499.5 | 323.1 | 458.5 | 635.1 | 723.2 | 699.6 | 648.7 | 590.2 | 542.3 | 519.9 |
| 2021 | 494.0 | 487.8 | 535.2 | 561.2 | 562.1 | 551.4 | 590.1 | 562.3 | 522.8 | 474.6 | 438.0 | 409.0 |
| 2022 | 361.9 | 388.5 | 366.5 | |||||||||
| - = No Data Reported; -- = Not Applicable; NA = Not Available; W = Withheld to avoid disclosure of individual company data. |
| Release Date: 5/19/2022 |
| Next Release Date: TBD |