|
Download Data (XLS File) |
|
||||||||
|
||||||||
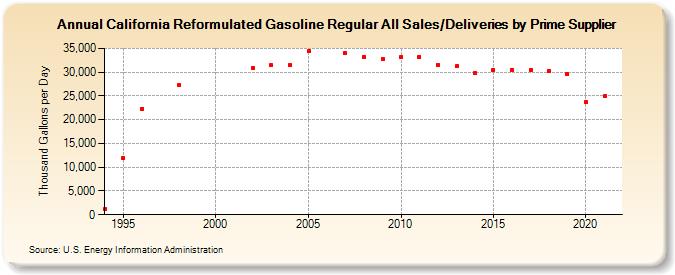
| California Reformulated Gasoline Regular All Sales/Deliveries by Prime Supplier (Thousand Gallons per Day) | ||||||||
| Decade | Year-0 | Year-1 | Year-2 | Year-3 | Year-4 | Year-5 | Year-6 | Year-7 | Year-8 | Year-9 |
|---|---|---|---|---|---|---|---|---|---|---|
| 1990's | 1,158.8 | 11,902.4 | 22,348.6 | W | 27,215.3 | W | ||||
| 2000's | W | W | 30,923.4 | 31,471.0 | 31,522.0 | 34,352.9 | W | 34,036.6 | 33,255.3 | 32,788.1 |
| 2010's | 33,183.1 | 33,204.0 | 31,577.4 | 31,225.0 | 29,778.4 | 30,476.9 | 30,489.4 | 30,371.0 | 30,263.9 | 29,512.3 |
| 2020's | 23,666.4 |
| - = No Data Reported; -- = Not Applicable; NA = Not Available; W = Withheld to avoid disclosure of individual company data. |
| Release Date: 6/1/2022 |
| Next Release Date: TBD |