|
Download Data (XLS File) |
|
||||||||
|
||||||||
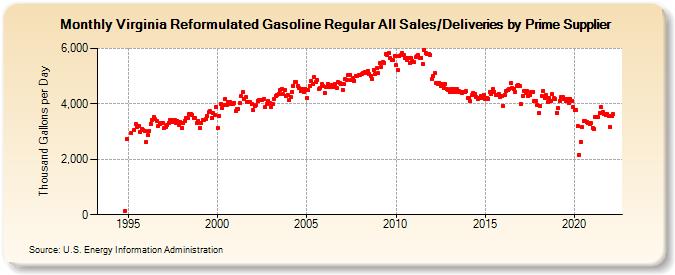
| Virginia Reformulated Gasoline Regular All Sales/Deliveries by Prime Supplier (Thousand Gallons per Day) | ||||||||
| Year | Jan | Feb | Mar | Apr | May | Jun | Jul | Aug | Sep | Oct | Nov | Dec |
|---|---|---|---|---|---|---|---|---|---|---|---|---|
| 1993 | - | - | - | |||||||||
| 1994 | - | - | - | - | - | - | - | - | - | - | 149.7 | 2,716.4 |
| 1995 | W | W | 2,948.1 | W | 3,044.2 | 3,266.5 | 3,172.1 | 3,191.5 | 2,991.3 | 3,101.6 | 3,045.1 | 3,011.9 |
| 1996 | 2,615.8 | 2,863.4 | 3,027.0 | 3,290.3 | 3,430.5 | 3,513.4 | 3,442.7 | 3,389.1 | 3,209.5 | 3,259.1 | 3,303.2 | 3,294.0 |
| 1997 | 3,146.0 | 3,163.8 | 3,249.1 | 3,316.2 | 3,402.3 | 3,358.6 | 3,426.3 | 3,421.7 | 3,306.7 | 3,390.1 | 3,249.7 | 3,355.1 |
| 1998 | 3,135.4 | 3,298.3 | 3,394.2 | 3,496.0 | 3,473.8 | 3,619.9 | 3,627.1 | 3,592.3 | 3,479.9 | 3,483.3 | 3,310.2 | 3,392.0 |
| 1999 | 3,121.1 | 3,317.0 | 3,419.1 | 3,410.4 | 3,440.4 | 3,554.7 | 3,692.8 | 3,727.7 | 3,502.9 | 3,668.4 | 3,608.5 | 3,870.5 |
| 2000 | 3,119.8 | 3,573.7 | 4,007.1 | 3,833.7 | 3,955.2 | 4,179.8 | 3,953.1 | 4,052.3 | 4,050.0 | 4,001.9 | 3,992.6 | 4,043.7 |
| 2001 | 3,730.8 | 3,799.9 | 3,814.5 | 4,016.9 | 4,264.7 | 4,411.6 | 4,167.6 | 4,232.7 | 4,055.9 | 4,068.0 | 4,053.4 | 4,001.7 |
| 2002 | 3,766.1 | 3,925.5 | 3,966.5 | 4,114.9 | 4,152.8 | 4,125.6 | 4,140.0 | 4,178.9 | 3,891.5 | 3,997.3 | 4,103.3 | 4,025.5 |
| 2003 | 3,900.3 | 3,987.4 | 4,175.0 | 4,279.7 | 4,307.3 | 4,355.7 | 4,498.7 | 4,540.2 | 4,344.4 | 4,499.7 | 4,272.6 | 4,330.6 |
| 2004 | 4,133.4 | 4,248.5 | 4,444.8 | 4,655.7 | 4,783.6 | 4,773.8 | 4,644.2 | 4,556.9 | 4,450.2 | 4,519.7 | 4,409.9 | 4,551.0 |
| 2005 | 4,227.5 | 4,504.4 | 4,649.3 | 4,817.1 | 4,721.1 | 4,957.1 | 4,790.6 | 4,861.5 | 4,527.3 | 4,582.7 | 4,709.3 | 4,632.0 |
| 2006 | 4,396.3 | 4,594.6 | 4,728.0 | 4,591.0 | 4,593.6 | 4,692.8 | 4,606.8 | 4,716.8 | 4,577.8 | 4,781.7 | 4,754.8 | 4,733.3 |
| 2007 | 4,516.8 | 4,697.8 | 4,884.7 | 4,868.7 | 5,036.6 | 5,054.0 | 4,849.7 | 4,927.2 | 4,833.4 | 5,017.5 | 4,999.8 | 5,027.7 |
| 2008 | 5,057.2 | 5,083.0 | 5,107.5 | 5,137.4 | 5,116.3 | 5,196.7 | 5,084.8 | 5,017.3 | 4,879.4 | 5,227.9 | 5,069.2 | 5,279.6 |
| 2009 | 5,098.4 | 5,462.5 | 5,345.0 | 5,501.2 | 5,486.5 | 5,802.0 | 5,761.1 | 5,826.2 | 5,651.3 | 5,568.9 | 5,569.7 | 5,740.5 |
| 2010 | 5,390.5 | 5,226.0 | 5,715.3 | 5,746.0 | 5,828.2 | 5,745.8 | 5,641.9 | 5,581.8 | 5,655.6 | 5,468.9 | 5,659.2 | 5,546.8 |
| 2011 | 5,502.2 | 5,679.8 | 5,728.6 | 5,754.1 | 5,671.2 | 5,654.2 | 5,441.3 | 5,955.7 | 5,821.1 | 5,800.2 | 5,793.1 | 5,762.3 |
| 2012 | 4,880.8 | 5,006.0 | 5,108.1 | 4,750.3 | 4,710.0 | 4,758.7 | 4,653.7 | 4,719.0 | 4,573.4 | 4,716.3 | 4,524.3 | 4,485.9 |
| 2013 | 4,415.0 | 4,528.0 | 4,416.3 | 4,538.0 | 4,441.9 | 4,520.1 | 4,449.7 | 4,425.9 | 4,398.8 | 4,433.9 | 4,413.6 | 4,453.5 |
| 2014 | 4,216.1 | 4,192.7 | 4,091.7 | 4,305.5 | 4,402.7 | 4,365.4 | 4,250.2 | 4,186.7 | 4,203.1 | 4,299.0 | 4,201.3 | 4,320.7 |
| 2015 | 4,163.0 | 4,224.5 | 4,188.4 | 4,438.6 | 4,345.8 | 4,517.5 | 4,432.6 | 4,323.5 | 4,334.6 | 4,372.1 | 4,232.9 | 4,294.3 |
| 2016 | 3,930.5 | 4,321.0 | 4,449.7 | 4,485.4 | 4,526.0 | 4,745.2 | 4,581.0 | 4,530.1 | 4,444.6 | 4,659.5 | 4,684.9 | 4,630.9 |
| 2017 | 3,996.5 | 4,290.1 | 4,454.6 | 4,404.2 | 4,470.3 | 4,278.8 | 4,332.9 | 4,420.6 | 4,439.1 | 4,109.3 | 4,093.4 | 3,951.6 |
| 2018 | 3,673.9 | 3,923.6 | 4,293.2 | 4,463.5 | 4,225.5 | 4,318.2 | 4,073.3 | 4,208.6 | 4,102.3 | 4,340.5 | 4,199.5 | 4,164.2 |
| 2019 | 3,685.5 | 3,844.7 | 4,107.8 | 4,234.6 | 4,228.9 | 4,163.8 | 4,105.1 | 4,190.9 | 4,035.7 | 4,187.6 | 4,086.8 | 3,893.3 |
| 2020 | 3,774.9 | 3,779.2 | 3,194.5 | 2,166.4 | 2,634.3 | 3,155.5 | 3,384.3 | 3,376.3 | 3,345.9 | 3,303.5 | 3,278.3 | 3,291.2 |
| 2021 | 3,137.1 | 3,087.8 | 3,529.5 | 3,514.2 | 3,515.4 | 3,684.5 | 3,868.2 | 3,700.1 | 3,645.0 | 3,601.3 | 3,640.2 | 3,558.2 |
| 2022 | 3,174.2 | 3,559.0 | 3,615.8 | |||||||||
| - = No Data Reported; -- = Not Applicable; NA = Not Available; W = Withheld to avoid disclosure of individual company data. |
| Release Date: 5/19/2022 |
| Next Release Date: TBD |