|
Download Data (XLS File) |
|
||||||||
|
||||||||
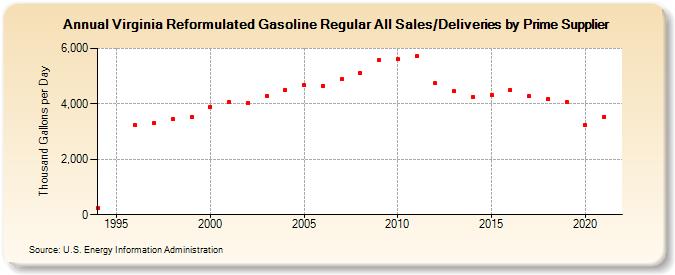
| Virginia Reformulated Gasoline Regular All Sales/Deliveries by Prime Supplier (Thousand Gallons per Day) | ||||||||
| Decade | Year-0 | Year-1 | Year-2 | Year-3 | Year-4 | Year-5 | Year-6 | Year-7 | Year-8 | Year-9 |
|---|---|---|---|---|---|---|---|---|---|---|
| 1990's | 243.0 | W | 3,220.6 | 3,316.8 | 3,442.7 | 3,529.6 | ||||
| 2000's | 3,897.4 | 4,052.6 | 4,032.9 | 4,293.2 | 4,515.1 | 4,665.4 | 4,647.7 | 4,893.9 | 5,105.2 | 5,567.9 |
| 2010's | 5,602.5 | 5,713.5 | 4,740.1 | 4,452.1 | 4,253.2 | 4,322.5 | 4,499.0 | 4,269.6 | 4,166.4 | 4,064.8 |
| 2020's | 3,223.3 |
| - = No Data Reported; -- = Not Applicable; NA = Not Available; W = Withheld to avoid disclosure of individual company data. |
| Release Date: 6/1/2022 |
| Next Release Date: TBD |