|
Download Data (XLS File) |
|
||||||||
|
||||||||
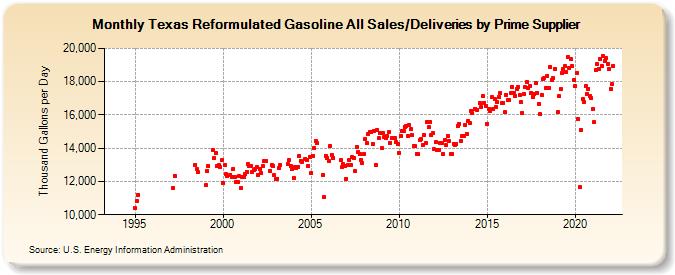
| Texas Reformulated Gasoline All Sales/Deliveries by Prime Supplier (Thousand Gallons per Day) | ||||||||
| Year | Jan | Feb | Mar | Apr | May | Jun | Jul | Aug | Sep | Oct | Nov | Dec |
|---|---|---|---|---|---|---|---|---|---|---|---|---|
| 1993 | - | - | - | |||||||||
| 1994 | - | - | - | - | - | - | - | - | - | - | W | W |
| 1995 | 10,383.0 | 10,825.3 | 11,204.8 | W | W | W | W | W | W | W | W | W |
| 1996 | W | W | W | W | W | W | W | W | W | W | W | W |
| 1997 | W | W | 11,635.2 | 12,356.3 | W | W | W | W | W | W | W | W |
| 1998 | W | W | W | W | W | 13,011.7 | 12,777.5 | 12,560.4 | W | W | W | W |
| 1999 | 11,764.5 | 12,655.5 | 12,930.8 | W | W | 13,871.6 | 13,396.9 | 13,712.7 | 12,957.7 | 12,967.3 | 12,844.2 | 13,288.9 |
| 2000 | 11,892.9 | 12,976.8 | 12,422.9 | 12,298.4 | W | 12,388.2 | 12,293.4 | 12,767.8 | 12,290.5 | 11,957.6 | 11,983.0 | 12,302.1 |
| 2001 | 11,596.3 | 12,240.2 | 12,265.5 | 12,433.3 | 12,584.8 | 13,026.5 | 12,907.4 | 12,950.7 | 12,577.2 | 12,711.6 | 12,729.4 | 12,879.4 |
| 2002 | 12,388.1 | 12,745.8 | 12,500.5 | 12,924.1 | 13,233.2 | 13,256.8 | W | W | 12,655.2 | 12,966.8 | 12,928.4 | 12,369.2 |
| 2003 | 12,143.1 | 12,177.3 | 12,803.1 | 12,966.0 | W | W | W | W | 13,063.3 | 13,265.3 | 12,918.4 | 12,733.5 |
| 2004 | 12,234.9 | 12,891.4 | 12,819.5 | 12,876.9 | 13,542.0 | 13,250.3 | 13,159.8 | W | 13,363.7 | 13,293.0 | 12,952.5 | 13,480.1 |
| 2005 | 12,499.5 | 13,542.3 | 14,014.7 | 14,443.4 | 14,288.6 | W | W | W | 12,398.6 | 11,061.0 | 13,555.6 | 13,402.2 |
| 2006 | 13,221.3 | 14,142.4 | 13,615.4 | 13,421.6 | W | W | W | W | 13,265.9 | 12,852.2 | 13,030.0 | 12,936.5 |
| 2007 | 12,172.5 | 13,004.3 | 13,283.5 | 12,962.0 | 13,460.5 | 13,409.8 | 12,624.4 | 14,072.0 | 13,783.0 | 13,645.6 | 13,313.3 | 13,114.3 |
| 2008 | 13,658.4 | 14,545.2 | 14,289.2 | 14,830.4 | 14,974.3 | 14,988.7 | 14,279.9 | 15,036.9 | 13,017.1 | 15,102.6 | 14,601.9 | 14,910.8 |
| 2009 | 14,010.0 | 14,890.4 | 14,643.8 | 14,591.6 | 14,746.6 | 14,965.7 | 14,306.1 | 14,597.7 | 14,617.6 | 14,587.8 | 14,372.0 | 14,274.0 |
| 2010 | 13,723.9 | 14,732.4 | 15,048.8 | 15,026.9 | 15,293.5 | 15,328.5 | 14,725.5 | 15,398.4 | 15,144.7 | 14,775.4 | 14,144.4 | 14,128.7 |
| 2011 | 13,659.0 | 13,626.9 | 14,465.4 | 14,550.5 | 14,197.1 | 14,790.6 | 14,301.3 | 15,570.7 | 15,248.3 | 15,583.4 | 14,776.8 | 14,895.6 |
| 2012 | 13,927.2 | 14,368.8 | 13,907.4 | 13,919.9 | 14,291.4 | 14,320.4 | 13,654.6 | 14,505.0 | 14,204.0 | 14,727.8 | 14,428.7 | 13,621.3 |
| 2013 | 13,658.1 | 14,269.9 | 14,203.3 | 14,240.4 | 15,362.7 | 15,460.8 | 14,451.5 | 14,705.2 | 14,759.1 | 15,400.3 | 14,881.6 | 15,656.5 |
| 2014 | 15,506.8 | 16,256.1 | 16,107.5 | W | 16,366.1 | 16,320.0 | W | 16,711.5 | 16,471.1 | 17,126.7 | 16,727.6 | 16,511.5 |
| 2015 | 15,462.2 | 16,325.9 | 16,247.3 | 17,061.9 | 16,365.2 | 16,944.7 | 16,488.6 | 16,748.7 | 17,100.5 | 17,311.1 | 16,724.0 | 16,738.0 |
| 2016 | 16,167.6 | 17,206.8 | 16,915.3 | 16,905.9 | 17,292.7 | 17,699.3 | 17,301.9 | 17,166.7 | 17,571.8 | 17,684.0 | 17,214.0 | 16,774.1 |
| 2017 | 16,125.0 | 17,278.6 | 17,655.1 | 17,952.8 | 17,594.1 | 17,732.9 | 17,329.5 | 17,079.0 | 17,240.6 | 17,946.0 | 17,318.0 | 16,671.5 |
| 2018 | 16,026.1 | 17,220.6 | 18,154.0 | 18,241.4 | 17,647.9 | 18,348.1 | 17,609.8 | 18,892.5 | 18,102.0 | 18,190.6 | 18,781.7 | W |
| 2019 | 16,173.4 | 17,108.4 | 17,556.1 | 18,522.8 | 18,743.5 | 18,940.0 | 18,567.0 | 19,477.5 | 18,845.1 | 19,338.2 | 18,929.3 | 18,071.1 |
| 2020 | 17,733.5 | 18,541.3 | 15,754.3 | 11,648.6 | 15,093.6 | 16,956.7 | 16,777.5 | 17,732.5 | 17,270.4 | 17,582.3 | 17,109.5 | 17,008.5 |
| 2021 | 16,341.5 | 15,551.0 | 18,706.3 | 19,042.0 | 18,783.5 | 19,388.2 | 18,961.3 | 19,528.5 | 19,244.5 | 19,405.1 | 19,076.6 | 18,760.3 |
| 2022 | 17,554.7 | 17,836.0 | 18,945.6 | |||||||||
| - = No Data Reported; -- = Not Applicable; NA = Not Available; W = Withheld to avoid disclosure of individual company data. |
| Release Date: 5/19/2022 |
| Next Release Date: TBD |