|
Download Data (XLS File) |
|
||||||||
|
||||||||
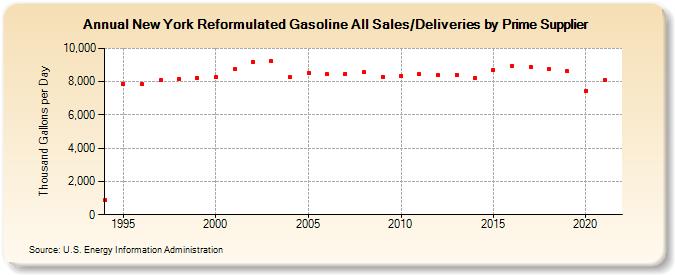
| New York Reformulated Gasoline All Sales/Deliveries by Prime Supplier (Thousand Gallons per Day) | ||||||||
| Decade | Year-0 | Year-1 | Year-2 | Year-3 | Year-4 | Year-5 | Year-6 | Year-7 | Year-8 | Year-9 |
|---|---|---|---|---|---|---|---|---|---|---|
| 1990's | 866.3 | 7,876.8 | 7,830.6 | 8,082.2 | 8,174.4 | 8,209.6 | ||||
| 2000's | 8,277.9 | 8,732.7 | 9,168.2 | 9,221.5 | 8,251.0 | 8,524.6 | 8,440.6 | 8,488.7 | 8,559.9 | 8,295.9 |
| 2010's | 8,350.2 | 8,433.3 | 8,390.4 | 8,418.5 | 8,233.9 | 8,709.8 | 8,961.4 | 8,910.8 | 8,744.1 | 8,620.7 |
| 2020's | 7,445.1 |
| - = No Data Reported; -- = Not Applicable; NA = Not Available; W = Withheld to avoid disclosure of individual company data. |
| Release Date: 6/1/2022 |
| Next Release Date: TBD |