|
Download Data (XLS File) |
|
||||||||
|
||||||||
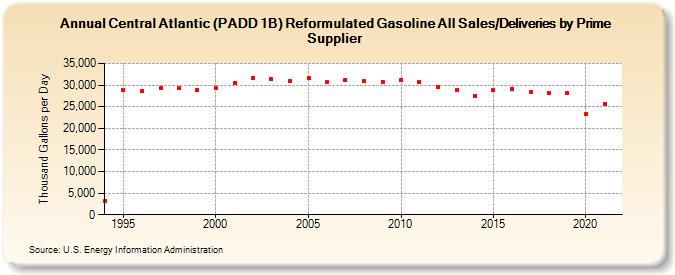
| Central Atlantic (PADD 1B) Reformulated Gasoline All Sales/Deliveries by Prime Supplier (Thousand Gallons per Day) | ||||||||
| Decade | Year-0 | Year-1 | Year-2 | Year-3 | Year-4 | Year-5 | Year-6 | Year-7 | Year-8 | Year-9 |
|---|---|---|---|---|---|---|---|---|---|---|
| 1990's | 3,261.9 | 28,807.9 | 28,698.9 | 29,297.0 | 29,254.7 | 28,940.5 | ||||
| 2000's | 29,283.0 | 30,554.4 | 31,620.8 | 31,346.1 | 30,955.9 | 31,694.2 | 30,690.6 | 31,257.3 | 31,046.9 | 30,798.4 |
| 2010's | 31,250.5 | 30,700.1 | 29,504.4 | 28,820.8 | 27,426.1 | 28,810.7 | 29,187.4 | 28,291.6 | 28,156.0 | 28,079.8 |
| 2020's | 23,332.8 |
| - = No Data Reported; -- = Not Applicable; NA = Not Available; W = Withheld to avoid disclosure of individual company data. |
| Release Date: 6/1/2022 |
| Next Release Date: TBD |