|
Download Data (XLS File) |
|
||||||||
|
||||||||
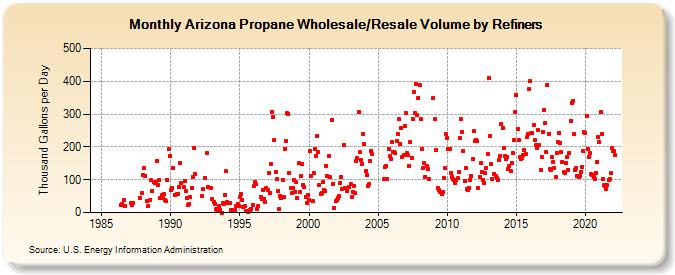
| Arizona Propane Wholesale/Resale Volume by Refiners (Thousand Gallons per Day) | ||||||||
| Year | Jan | Feb | Mar | Apr | May | Jun | Jul | Aug | Sep | Oct | Nov | Dec |
|---|---|---|---|---|---|---|---|---|---|---|---|---|
| 1984 | - | W | W | W | ||||||||
| 1985 | W | W | W | W | W | W | W | W | W | W | W | W |
| 1986 | W | W | W | W | W | 23.3 | 25.5 | 37.8 | 19.6 | W | W | W |
| 1987 | W | 29.7 | 21.9 | 29.1 | W | W | W | W | W | 43.8 | W | 60.3 |
| 1988 | 113.4 | 136.4 | 112.7 | 36.5 | 19.0 | W | 39.4 | 99.8 | 66.8 | 92.6 | 88.7 | 91.7 |
| 1989 | 155.9 | 84.4 | 99.3 | 43.5 | 52.4 | 44.6 | 57.0 | 38.5 | 34.3 | 99.4 | 192.7 | 173.4 |
| 1990 | 68.8 | 73.8 | 134.7 | W | 52.2 | 55.7 | 57.6 | 79.0 | 151.4 | 88.6 | W | 76.9 |
| 1991 | 95.5 | 64.4 | 44.8 | 21.7 | 25.8 | 46.4 | 76.0 | 109.1 | 196.3 | 117.6 | W | W |
| 1992 | W | W | W | 49.4 | 71.6 | NA | 105.7 | 182.0 | 78.5 | W | W | 75.2 |
| 1993 | 42.4 | 31.4 | 27.3 | 11.1 | 8.0 | 11.6 | 18.7 | 7.7 | 0.0 | 29.7 | 25.0 | 53.1 |
| 1994 | 125.5 | 33.0 | 29.7 | 28.6 | 8.1 | W | 5.5 | 8.6 | 6.6 | 20.9 | 27.3 | 20.9 |
| 1995 | 47.5 | 57.2 | 39.6 | 15.8 | 19.5 | 5.0 | W | 1.5 | W | 7.1 | 11.4 | 24.4 |
| 1996 | 79.9 | 94.2 | 85.8 | 10.4 | 18.8 | W | 46.3 | 41.3 | 69.6 | 40.7 | 31.6 | 74.5 |
| 1997 | 69.7 | 121.1 | 59.1 | 149.3 | 306.7 | 291.3 | 220.7 | 124.6 | 102.0 | 65.7 | 11.9 | 50.7 |
| 1998 | 44.1 | 100.6 | 47.8 | 194.4 | 217.1 | 302.6 | 301.1 | 120.9 | 75.9 | 58.5 | 76.1 | 98.3 |
| 1999 | 63.6 | 92.1 | 43.9 | 150.4 | 62.4 | 111.7 | 149.2 | 84.1 | 78.3 | 47.1 | 30.5 | 54.6 |
| 2000 | 38.3 | 188.6 | 112.2 | 34.3 | 120.6 | 193.5 | 173.2 | 234.2 | 183.4 | 83.6 | 57.0 | 59.2 |
| 2001 | 91.8 | 69.7 | 67.1 | 142.8 | 112.5 | 171.3 | 108.1 | W | 283.3 | 87.1 | 15.4 | 34.0 |
| 2002 | 37.4 | 44.7 | 50.1 | 90.9 | 109.2 | 72.7 | 207.2 | 74.6 | W | 65.7 | W | 78.5 |
| 2003 | 86.5 | 47.9 | 63.9 | 81.2 | 58.5 | 156.6 | 165.5 | 306.8 | 185.4 | 159.7 | 147.4 | 238.1 |
| 2004 | 207.9 | 125.2 | 114.9 | 80.7 | 86.2 | 157.1 | 188.5 | 177.2 | W | W | W | W |
| 2005 | NA | NA | W | W | W | 102.4 | 139.8 | 141.4 | 102.0 | 192.3 | 171.9 | 162.2 |
| 2006 | 215.2 | 185.7 | 184.1 | 180.7 | 216.7 | 239.6 | 283.9 | 209.4 | 257.6 | 170.4 | 175.1 | 262.4 |
| 2007 | 303.7 | 180.4 | 174.5 | 142.7 | 213.5 | 165.8 | 284.4 | 368.1 | 302.9 | 392.6 | 296.0 | 348.5 |
| 2008 | 387.3 | 284.7 | 195.0 | 136.7 | 149.7 | 109.6 | 141.7 | 132.6 | 100.7 | W | W | W |
| 2009 | 349.0 | 283.9 | 189.6 | W | 73.6 | 70.1 | 62.4 | 55.4 | 61.9 | 105.8 | 134.6 | 238.3 |
| 2010 | 225.6 | 195.0 | 192.6 | 121.1 | 107.1 | 101.5 | 98.9 | 89.1 | 98.2 | 104.4 | 124.0 | 226.9 |
| 2011 | 283.5 | 245.8 | 187.3 | 96.5 | 136.6 | 72.0 | 69.1 | 75.2 | 99.7 | 112.7 | 162.0 | 247.2 |
| 2012 | 216.5 | 220.9 | 217.7 | 75.4 | 109.3 | 150.8 | 123.6 | 99.7 | 88.7 | 120.8 | 136.5 | 179.3 |
| 2013 | 410.1 | 231.9 | 146.6 | 101.8 | W | 117.5 | 110.4 | 105.1 | 100.2 | 158.6 | 171.5 | 270.5 |
| 2014 | 257.1 | 197.0 | 173.3 | 162.7 | 168.0 | 134.1 | 142.2 | 125.8 | 152.4 | 180.7 | 220.3 | 307.7 |
| 2015 | 357.4 | 254.3 | 220.5 | 168.4 | 163.8 | 167.1 | 173.9 | 189.5 | 177.6 | 229.7 | 240.4 | 375.8 |
| 2016 | 401.7 | 241.4 | 241.1 | 265.8 | 220.6 | 204.4 | 196.1 | 251.5 | 205.2 | 131.1 | 169.4 | 246.2 |
| 2017 | 312.8 | 272.0 | 185.0 | 389.4 | 240.6 | 132.3 | 130.0 | 168.1 | 154.5 | 135.3 | 107.9 | 180.8 |
| 2018 | 215.8 | 243.0 | 212.4 | 183.8 | 154.9 | 122.2 | 121.5 | 151.1 | 168.8 | 130.8 | 181.7 | 280.1 |
| 2019 | 335.2 | 340.0 | 238.5 | 128.1 | 137.2 | 111.1 | 108.3 | 112.2 | 122.5 | 139.8 | 186.0 | 246.6 |
| 2020 | 242.0 | 294.1 | 193.6 | 169.6 | 180.3 | 116.0 | 114.9 | 109.8 | 103.2 | 120.9 | 155.0 | 229.0 |
| 2021 | 214.2 | 305.6 | 238.8 | 102.9 | 82.9 | 79.8 | 72.7 | 82.8 | 97.7 | 103.7 | 121.0 | 195.9 |
| 2022 | 187.6 | 186.4 | 174.2 | |||||||||
| - = No Data Reported; -- = Not Applicable; NA = Not Available; W = Withheld to avoid disclosure of individual company data. |
| Release Date: 6/1/2022 |
| Next Release Date: TBD |