|
Download Data (XLS File) |
|
||||||||
|
||||||||
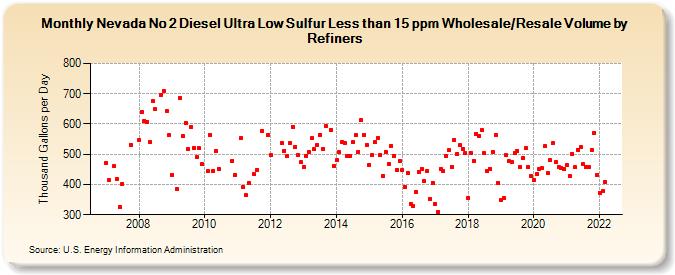
| Nevada No 2 Diesel Ultra Low Sulfur Less than 15 ppm Wholesale/Resale Volume by Refiners (Thousand Gallons per Day) | ||||||||
| Year | Jan | Feb | Mar | Apr | May | Jun | Jul | Aug | Sep | Oct | Nov | Dec |
|---|---|---|---|---|---|---|---|---|---|---|---|---|
| 2007 | 472.5 | 413.8 | W | 459.6 | 419.7 | 325.6 | 402.7 | W | W | 531.7 | W | W |
| 2008 | 545.7 | 639.7 | 610.9 | 607.0 | 540.8 | 675.1 | 648.2 | W | 696.4 | 710.6 | 643.3 | 563.2 |
| 2009 | 432.8 | W | 385.8 | 687.0 | 559.5 | 604.4 | 516.9 | 591.2 | 519.9 | 490.5 | 519.4 | 466.1 |
| 2010 | W | 443.3 | 564.9 | 444.7 | 509.0 | 451.4 | W | W | W | W | 479.2 | 432.6 |
| 2011 | W | 553.1 | 390.8 | 364.2 | 405.9 | W | 433.2 | 449.3 | W | 577.5 | W | 564.5 |
| 2012 | 495.9 | W | W | W | 536.5 | 511.6 | 492.5 | 536.8 | 590.9 | 524.4 | 496.3 | 473.1 |
| 2013 | 457.6 | 494.5 | 508.8 | 553.2 | 516.4 | 530.2 | 564.8 | 518.2 | 592.1 | W | 581.0 | 461.6 |
| 2014 | 479.5 | 506.2 | 540.1 | 536.5 | 495.0 | 494.6 | 539.2 | 562.7 | 508.5 | 611.5 | 565.0 | 530.8 |
| 2015 | 465.2 | 496.7 | 539.1 | 553.9 | 497.5 | 429.6 | 507.9 | 468.5 | 527.6 | 492.8 | 449.1 | 478.5 |
| 2016 | 446.6 | 392.2 | 438.5 | 336.9 | 328.7 | 376.3 | 442.3 | 452.5 | 409.9 | 445.1 | 353.1 | 406.0 |
| 2017 | 336.1 | 309.3 | 451.4 | 444.4 | 495.3 | 513.9 | 459.4 | 548.3 | 502.3 | 529.5 | 518.2 | 502.4 |
| 2018 | 355.4 | 504.3 | 479.2 | 567.8 | 561.8 | 580.7 | 502.8 | 444.5 | 452.3 | 508.4 | 563.0 | 406.1 |
| 2019 | 348.1 | 355.8 | 496.4 | 476.3 | 473.5 | 502.6 | 511.5 | 458.7 | 488.3 | 519.1 | 457.4 | 427.6 |
| 2020 | 415.1 | 435.5 | 450.4 | 453.1 | 526.2 | 436.8 | 480.9 | 535.9 | 474.3 | 457.5 | 454.8 | 451.8 |
| 2021 | 464.7 | 428.7 | 501.3 | 456.1 | 514.3 | 522.8 | 466.7 | 456.9 | 456.6 | 513.6 | 571.3 | 432.6 |
| 2022 | 373.1 | 377.1 | 408.9 | |||||||||
| - = No Data Reported; -- = Not Applicable; NA = Not Available; W = Withheld to avoid disclosure of individual company data. |
| Release Date: 6/1/2022 |
| Next Release Date: TBD |