|
Download Data (XLS File) |
|
||||||||
|
||||||||
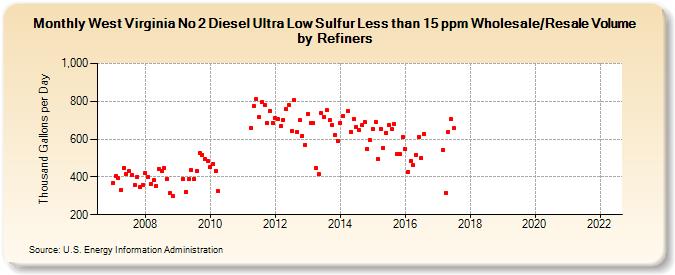
| West Virginia No 2 Diesel Ultra Low Sulfur Less than 15 ppm Wholesale/Resale Volume by Refiners (Thousand Gallons per Day) | ||||||||
| Year | Jan | Feb | Mar | Apr | May | Jun | Jul | Aug | Sep | Oct | Nov | Dec |
|---|---|---|---|---|---|---|---|---|---|---|---|---|
| 2007 | 368.5 | 404.6 | 392.1 | 332.0 | 447.5 | 417.8 | 429.6 | 408.9 | 355.0 | 401.0 | 346.3 | 358.8 |
| 2008 | 420.9 | 400.4 | 363.0 | 382.3 | 351.7 | 442.5 | 431.1 | 446.1 | 389.2 | 313.2 | 301.5 | W |
| 2009 | W | W | 388.4 | 321.9 | 387.4 | 435.8 | 390.1 | 431.1 | 525.6 | 517.7 | 492.9 | 485.7 |
| 2010 | 449.9 | 468.4 | 432.3 | 325.3 | W | W | W | W | W | W | W | W |
| 2011 | W | W | W | 660.5 | 776.3 | 809.5 | 717.9 | 794.3 | 779.0 | 683.9 | 750.0 | 686.5 |
| 2012 | 709.2 | 704.0 | 669.0 | 702.4 | 759.0 | 779.4 | 645.1 | 807.3 | 640.0 | 699.5 | 618.6 | 570.5 |
| 2013 | 735.4 | 685.9 | 683.2 | 448.0 | 413.5 | 735.6 | 717.5 | 751.5 | 699.8 | 674.3 | 622.9 | 592.5 |
| 2014 | 687.8 | 722.8 | W | 748.0 | 639.8 | 706.3 | 663.9 | 648.0 | 672.1 | 692.6 | 548.7 | 593.2 |
| 2015 | 654.3 | 692.5 | 495.2 | 655.8 | 555.1 | 634.2 | 673.1 | 651.7 | 679.1 | 521.7 | 519.4 | 610.3 |
| 2016 | 546.6 | 426.3 | 484.3 | 461.3 | 518.2 | 612.0 | 500.8 | 629.0 | W | W | W | W |
| 2017 | W | W | 543.4 | 317.5 | 637.9 | 703.9 | 656.5 | W | W | W | W | W |
| 2018 | W | W | W | W | W | W | W | W | W | W | W | W |
| 2019 | W | W | W | W | W | W | W | W | W | W | W | W |
| 2020 | W | W | W | W | W | W | W | W | W | W | W | W |
| 2021 | W | W | W | W | W | W | W | W | W | W | W | W |
| 2022 | W | W | W | |||||||||
| - = No Data Reported; -- = Not Applicable; NA = Not Available; W = Withheld to avoid disclosure of individual company data. |
| Release Date: 6/1/2022 |
| Next Release Date: TBD |