|
Download Data (XLS File) |
|
||||||||
|
||||||||
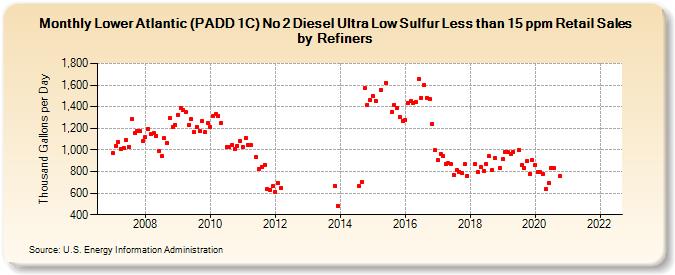
| Lower Atlantic (PADD 1C) No 2 Diesel Ultra Low Sulfur Less than 15 ppm Retail Sales by Refiners (Thousand Gallons per Day) | ||||||||
| Year | Jan | Feb | Mar | Apr | May | Jun | Jul | Aug | Sep | Oct | Nov | Dec |
|---|---|---|---|---|---|---|---|---|---|---|---|---|
| 2007 | 968.3 | 1,034.7 | 1,072.7 | 1,011.2 | 1,014.4 | 1,088.8 | 1,030.2 | 1,287.1 | 1,152.4 | 1,173.6 | 1,171.1 | 1,078.5 |
| 2008 | 1,119.4 | 1,196.9 | 1,144.8 | 1,155.3 | 1,128.9 | 994.2 | 942.1 | 1,106.1 | 1,064.2 | 1,293.9 | 1,216.3 | 1,231.5 |
| 2009 | 1,326.7 | 1,388.1 | 1,368.8 | 1,346.6 | 1,232.3 | 1,284.4 | 1,165.6 | 1,214.3 | 1,172.6 | 1,264.2 | 1,162.5 | 1,247.5 |
| 2010 | 1,216.5 | 1,312.3 | 1,330.0 | 1,316.8 | 1,252.5 | W | 1,028.2 | 1,027.8 | 1,047.0 | 1,008.2 | 1,038.7 | 1,078.3 |
| 2011 | 1,028.3 | 1,112.4 | 1,048.4 | 1,046.0 | W | 935.8 | 827.0 | 845.5 | 864.1 | 637.5 | 630.9 | 661.7 |
| 2012 | 608.5 | 692.1 | 649.0 | W | W | W | W | W | W | W | W | W |
| 2013 | W | W | W | W | W | W | W | W | W | W | 669.0 | 485.3 |
| 2014 | W | W | W | W | W | W | W | 665.5 | 707.2 | 1,570.0 | 1,416.0 | 1,459.4 |
| 2015 | 1,500.0 | 1,455.4 | W | 1,555.6 | W | 1,622.2 | W | 1,347.2 | 1,417.8 | 1,385.7 | 1,306.1 | 1,270.1 |
| 2016 | 1,275.8 | 1,438.7 | 1,452.2 | 1,436.4 | 1,438.9 | 1,654.9 | 1,484.8 | 1,598.0 | 1,484.5 | 1,472.3 | 1,240.0 | 995.2 |
| 2017 | 907.3 | 962.1 | 944.8 | 870.0 | 876.1 | 867.1 | 769.2 | 812.0 | 798.0 | 785.9 | 866.8 | 762.6 |
| 2018 | W | W | 865.5 | 793.7 | 843.0 | 803.8 | 865.4 | 940.5 | 812.3 | 927.0 | W | 836.1 |
| 2019 | 912.9 | 980.9 | 980.8 | 960.9 | 984.8 | W | 999.1 | 858.2 | 831.0 | 895.3 | 777.3 | 902.6 |
| 2020 | 855.7 | 799.7 | 792.7 | 776.6 | 639.5 | 692.0 | 832.7 | 828.9 | W | 757.8 | W | W |
| 2021 | W | W | W | W | W | W | W | W | W | W | W | W |
| 2022 | W | W | W | |||||||||
| - = No Data Reported; -- = Not Applicable; NA = Not Available; W = Withheld to avoid disclosure of individual company data. |
| Release Date: 6/1/2022 |
| Next Release Date: TBD |