|
Download Data (XLS File) |
|
||||||||
|
||||||||
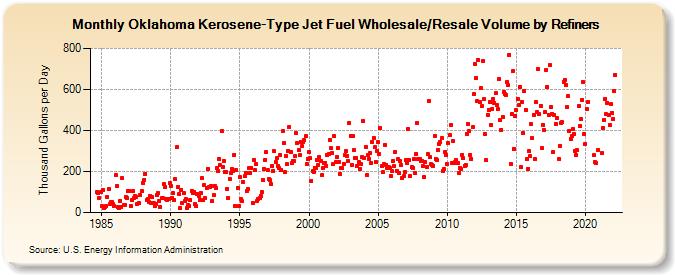
| Oklahoma Kerosene-Type Jet Fuel Wholesale/Resale Volume by Refiners (Thousand Gallons per Day) | ||||||||
| Year | Jan | Feb | Mar | Apr | May | Jun | Jul | Aug | Sep | Oct | Nov | Dec |
|---|---|---|---|---|---|---|---|---|---|---|---|---|
| 1984 | 99.5 | 93.6 | 72.0 | 98.3 | ||||||||
| 1985 | 30.0 | 109.1 | 23.5 | 28.5 | 31.8 | 75.9 | 114.2 | 42.0 | 50.2 | 50.6 | 39.4 | 32.6 |
| 1986 | 181.5 | 129.6 | 24.9 | 23.7 | 56.5 | 27.9 | 168.3 | 36.7 | 37.7 | 77.8 | 71.8 | 102.8 |
| 1987 | 104.1 | 34.3 | 59.8 | 102.9 | 70.3 | 79.7 | 77.4 | 44.0 | 48.6 | 83.4 | W | 103.0 |
| 1988 | 144.5 | 159.6 | 189.6 | 61.0 | 67.6 | 49.5 | 79.5 | 44.6 | 74.1 | 44.6 | 29.9 | 41.5 |
| 1989 | 85.7 | 95.2 | 54.4 | 27.5 | 68.9 | 70.0 | 137.7 | 123.5 | 68.1 | 62.5 | 66.5 | 143.6 |
| 1990 | 129.8 | 72.3 | 93.8 | 62.2 | 161.9 | 318.0 | 125.0 | 89.0 | 22.0 | 110.7 | 49.0 | 93.6 |
| 1991 | 56.4 | 65.6 | 20.6 | 36.0 | 31.6 | 60.3 | 107.3 | 93.5 | 101.8 | 40.5 | 32.9 | 91.0 |
| 1992 | 79.9 | 63.3 | 95.6 | 167.6 | 60.9 | 134.3 | 69.8 | 122.0 | 214.3 | 122.7 | 125.9 | 129.5 |
| 1993 | 57.5 | 83.8 | 129.5 | 120.2 | 217.2 | 204.1 | 261.1 | 230.3 | 397.3 | 223.8 | 252.2 | 198.1 |
| 1994 | 199.1 | 116.6 | 72.2 | 165.9 | 193.7 | 212.3 | 201.8 | 281.4 | 34.0 | 207.7 | 120.1 | 31.6 |
| 1995 | 171.2 | 65.4 | 55.0 | 149.0 | 176.4 | 191.4 | 104.3 | 112.4 | 217.0 | 192.7 | 218.4 | 47.2 |
| 1996 | 257.6 | 206.0 | 236.6 | 54.3 | 65.1 | 72.4 | 82.0 | 100.3 | 161.1 | 213.5 | 256.4 | 294.3 |
| 1997 | 207.2 | 165.9 | 157.3 | 137.3 | 226.2 | 203.9 | 297.9 | 245.2 | 263.8 | 228.6 | 218.1 | 280.4 |
| 1998 | 208.6 | 395.1 | 338.3 | 195.6 | 275.4 | 234.4 | 302.4 | 417.8 | 294.5 | 239.2 | 253.6 | 251.4 |
| 1999 | 273.6 | 386.9 | 339.8 | 306.9 | 278.9 | 345.7 | 322.8 | 342.7 | 352.1 | 371.1 | 235.0 | 261.2 |
| 2000 | 295.5 | 265.0 | 154.5 | 200.1 | 195.4 | 218.8 | 219.1 | 256.9 | 233.1 | 270.4 | 252.4 | 182.8 |
| 2001 | 219.2 | 241.1 | 243.0 | 227.7 | 279.5 | 284.9 | 353.7 | 312.8 | 290.3 | 236.3 | 371.9 | 244.1 |
| 2002 | 270.1 | 313.4 | 247.8 | 188.9 | 219.2 | 214.9 | 238.0 | 278.2 | 298.1 | 277.0 | 250.2 | 438.4 |
| 2003 | 373.9 | 233.3 | 372.3 | 303.7 | 264.4 | 263.8 | 229.3 | 246.0 | 214.3 | 236.1 | 268.4 | 447.0 |
| 2004 | 267.1 | 321.6 | 182.9 | 279.8 | 263.3 | 290.5 | 241.8 | 344.9 | 364.8 | 318.2 | 244.3 | 301.6 |
| 2005 | 343.7 | 286.1 | 412.8 | 227.5 | 196.0 | 238.3 | 331.1 | 232.9 | 215.8 | 222.2 | 215.6 | 179.5 |
| 2006 | 201.2 | 252.9 | 225.0 | 295.5 | 204.8 | 259.3 | 193.7 | 249.9 | 229.8 | 167.5 | 177.0 | 196.5 |
| 2007 | 255.5 | 239.5 | 407.0 | 255.8 | 177.3 | 220.2 | 216.4 | 259.9 | 194.2 | 286.4 | 436.5 | 262.1 |
| 2008 | 258.7 | 253.1 | 253.0 | 225.5 | 171.2 | 246.3 | 223.2 | 283.5 | 542.3 | 269.5 | 234.7 | 233.8 |
| 2009 | 229.2 | 374.9 | 263.0 | 255.3 | 306.8 | 336.3 | 343.3 | 362.1 | 201.0 | 213.7 | 293.2 | 280.9 |
| 2010 | 236.2 | 338.4 | 376.9 | 427.0 | 243.2 | 349.4 | 241.6 | 248.4 | 254.8 | 241.3 | 193.0 | 218.3 |
| 2011 | 210.1 | 282.8 | 263.6 | 228.3 | 233.1 | 385.1 | 430.7 | 395.5 | 280.9 | 261.5 | 414.8 | 575.8 |
| 2012 | 724.0 | 656.7 | 543.5 | 744.8 | 537.5 | 605.0 | 516.9 | 738.5 | 553.1 | 381.7 | 255.3 | 477.6 |
| 2013 | 501.5 | 539.4 | 429.0 | 504.8 | 553.8 | 533.8 | 580.2 | 523.4 | 503.0 | 653.1 | 450.6 | 404.4 |
| 2014 | 466.7 | 588.3 | 576.3 | 571.9 | 636.1 | 621.5 | 769.3 | 236.8 | 479.1 | 687.7 | 311.5 | 472.1 |
| 2015 | 497.4 | 554.8 | 522.9 | 613.6 | 220.0 | 539.7 | 387.4 | 594.2 | 500.5 | 260.9 | 214.1 | 297.6 |
| 2016 | 275.2 | 429.2 | 361.5 | 477.5 | 260.1 | 536.5 | 491.1 | 699.3 | 479.1 | 521.5 | 313.1 | 428.2 |
| 2017 | 403.3 | 491.0 | 696.9 | 612.8 | 476.6 | 719.3 | 513.1 | 482.1 | 293.3 | 475.2 | 433.5 | 459.4 |
| 2018 | NA | 260.7 | 326.1 | 438.0 | 439.5 | 636.6 | 646.6 | 620.6 | 514.1 | 566.4 | 397.6 | 358.8 |
| 2019 | 372.8 | 406.5 | 385.0 | 301.5 | 281.9 | 302.8 | 518.6 | 419.6 | 454.5 | 550.4 | 635.3 | 384.9 |
| 2020 | 334.4 | 505.0 | 538.7 | W | W | W | W | 279.1 | 246.1 | 240.9 | W | 303.9 |
| 2021 | W | W | 290.9 | 413.2 | 452.5 | 555.3 | 478.5 | 536.3 | 474.4 | 426.7 | 526.8 | 485.5 |
| 2022 | 457.7 | 592.7 | 669.5 | |||||||||
| - = No Data Reported; -- = Not Applicable; NA = Not Available; W = Withheld to avoid disclosure of individual company data. |
| Release Date: 6/1/2022 |
| Next Release Date: TBD |