|
Download Data (XLS File) |
|
||||||||
|
||||||||
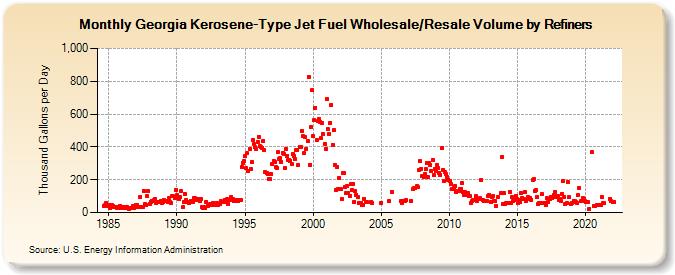
| Georgia Kerosene-Type Jet Fuel Wholesale/Resale Volume by Refiners (Thousand Gallons per Day) | ||||||||
| Year | Jan | Feb | Mar | Apr | May | Jun | Jul | Aug | Sep | Oct | Nov | Dec |
|---|---|---|---|---|---|---|---|---|---|---|---|---|
| 1984 | 41.3 | 45.7 | 58.1 | 42.1 | ||||||||
| 1985 | 45.5 | 29.2 | 45.8 | 45.4 | 40.8 | 32.4 | 31.8 | 30.5 | 32.1 | 30.4 | 42.0 | 35.2 |
| 1986 | 30.0 | 32.9 | 29.3 | 33.6 | 33.2 | 30.1 | 24.2 | 26.8 | 26.9 | 37.8 | 27.3 | 35.9 |
| 1987 | 47.5 | 48.4 | 36.4 | 34.2 | 95.9 | 33.9 | 36.4 | 133.6 | 52.1 | 46.1 | 98.7 | 131.3 |
| 1988 | 53.8 | 66.1 | 72.8 | 71.3 | 73.9 | 81.3 | 55.9 | 63.3 | 66.5 | 64.1 | 71.6 | 55.9 |
| 1989 | 61.8 | 74.8 | 68.5 | 71.3 | 66.5 | 86.2 | 65.2 | 58.7 | 102.4 | 98.6 | 88.8 | 139.7 |
| 1990 | 105.6 | 92.8 | 83.7 | 94.5 | 129.3 | 31.6 | 64.8 | 112.0 | 75.5 | 66.0 | 65.8 | 55.6 |
| 1991 | 71.5 | 66.2 | 62.7 | 90.0 | 86.0 | 79.3 | 84.0 | 80.8 | 70.3 | 85.0 | 32.0 | 25.0 |
| 1992 | 32.5 | 28.7 | 67.3 | 41.9 | 46.0 | 49.4 | 45.1 | 47.3 | 60.2 | 47.8 | 47.7 | 57.3 |
| 1993 | 47.5 | 52.3 | 53.7 | 67.4 | 65.3 | 62.1 | 78.6 | 65.8 | 80.5 | 50.9 | 78.5 | 77.8 |
| 1994 | 93.4 | 83.4 | 72.8 | 75.3 | 68.0 | 78.1 | 69.6 | 76.1 | 78.1 | 277.1 | 302.2 | 312.3 |
| 1995 | 344.4 | 269.2 | 361.5 | 251.5 | 388.1 | 264.5 | 309.1 | 442.0 | 418.9 | 397.5 | 389.3 | 431.5 |
| 1996 | 463.2 | 404.6 | 398.4 | 395.0 | 436.0 | 380.1 | 247.0 | 243.3 | 232.4 | 206.5 | 202.3 | 236.9 |
| 1997 | 297.0 | 315.4 | 305.2 | 275.3 | 273.1 | 369.5 | 328.9 | 333.1 | 309.1 | 364.5 | 358.1 | 272.4 |
| 1998 | 387.9 | 346.6 | 318.0 | 320.3 | 316.9 | 297.9 | 356.0 | 346.4 | 325.2 | 380.6 | 379.8 | 289.5 |
| 1999 | 398.0 | 401.3 | 499.0 | 464.9 | 360.7 | 457.7 | 386.2 | 438.5 | 828.2 | 292.2 | 521.3 | 745.8 |
| 2000 | 464.4 | 564.6 | 639.1 | 442.0 | 557.0 | 569.1 | 553.3 | 451.3 | 548.1 | 478.5 | 418.8 | 387.5 |
| 2001 | 692.5 | 507.0 | 479.6 | 548.4 | 655.3 | 413.8 | 503.2 | 292.6 | 140.0 | 280.1 | 145.3 | 211.4 |
| 2002 | 142.4 | 83.2 | 240.4 | 239.8 | 157.8 | 118.3 | 163.0 | 119.6 | 101.6 | 171.5 | 139.8 | 175.2 |
| 2003 | 64.4 | 129.8 | 109.7 | 96.3 | 59.1 | W | 60.0 | 43.9 | 47.1 | 84.6 | 62.0 | 62.0 |
| 2004 | W | W | W | 67.3 | 57.5 | W | W | W | W | W | W | W |
| 2005 | 57.3 | W | W | W | W | W | W | 67.5 | W | 127.8 | W | W |
| 2006 | W | W | W | W | W | 68.6 | 58.7 | 68.5 | 69.7 | 69.7 | 76.1 | W |
| 2007 | W | W | 70.7 | W | 143.7 | 152.5 | 146.8 | 159.2 | 154.7 | 257.6 | 314.3 | 267.8 |
| 2008 | 221.2 | 215.3 | 237.5 | 262.7 | 300.7 | 218.1 | 302.8 | 290.5 | 250.6 | 321.6 | 226.7 | 267.9 |
| 2009 | 255.4 | 292.5 | 271.8 | 243.0 | 231.0 | 393.2 | 260.6 | 192.3 | 244.8 | 233.1 | 218.4 | 199.0 |
| 2010 | 193.9 | 175.3 | 144.6 | 145.2 | 151.4 | 161.3 | 123.4 | 131.2 | 128.8 | 144.2 | 144.4 | 182.2 |
| 2011 | 124.1 | 106.5 | 122.5 | 105.5 | 120.0 | 100.0 | 100.0 | 60.4 | 68.2 | 77.7 | 76.7 | 98.0 |
| 2012 | 71.2 | 80.6 | 85.1 | 86.1 | 199.7 | 78.1 | 68.7 | 68.3 | 71.8 | 71.8 | 102.6 | 106.3 |
| 2013 | 61.6 | 97.3 | 99.3 | 71.1 | 70.3 | 40.7 | W | 94.5 | W | 120.1 | 339.6 | 54.5 |
| 2014 | 117.6 | 54.4 | 58.7 | 55.3 | W | 126.8 | 58.5 | 93.5 | 69.3 | 77.3 | 101.9 | 83.7 |
| 2015 | 58.1 | 75.8 | 65.4 | 120.4 | 90.5 | 84.7 | 126.6 | 72.0 | 79.9 | 95.9 | 88.9 | 88.6 |
| 2016 | 79.3 | 197.3 | 202.1 | 134.0 | 136.6 | 95.4 | 49.9 | 56.4 | 56.3 | 111.3 | W | 57.4 |
| 2017 | 56.8 | 44.5 | 87.1 | 66.8 | 82.8 | 95.2 | 89.9 | 94.8 | 107.3 | 127.6 | 95.7 | 102.7 |
| 2018 | 75.9 | 84.5 | 72.3 | 116.1 | 190.4 | 95.7 | 54.8 | 55.4 | 184.8 | 92.6 | W | 52.2 |
| 2019 | 60.6 | 73.0 | 69.0 | 64.8 | 61.2 | 104.7 | 152.6 | W | 73.3 | 88.1 | 81.1 | 70.7 |
| 2020 | 65.5 | 65.0 | 62.9 | 24.7 | W | 366.2 | W | 41.0 | 42.7 | W | 45.6 | 46.7 |
| 2021 | 48.2 | 45.0 | 94.6 | 56.0 | 55.7 | W | W | W | W | 85.4 | 69.9 | W |
| 2022 | 65.4 | 64.6 | W | |||||||||
| - = No Data Reported; -- = Not Applicable; NA = Not Available; W = Withheld to avoid disclosure of individual company data. |
| Release Date: 6/1/2022 |
| Next Release Date: TBD |