|
Download Data (XLS File) |
|
||||||||
|
||||||||
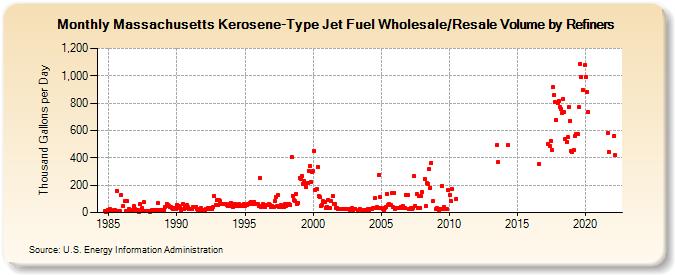
| Massachusetts Kerosene-Type Jet Fuel Wholesale/Resale Volume by Refiners (Thousand Gallons per Day) | ||||||||
| Year | Jan | Feb | Mar | Apr | May | Jun | Jul | Aug | Sep | Oct | Nov | Dec |
|---|---|---|---|---|---|---|---|---|---|---|---|---|
| 1984 | W | 13.2 | 5.6 | 21.4 | ||||||||
| 1985 | 13.1 | 26.9 | W | W | 12.6 | 21.9 | 16.9 | 160.6 | 13.1 | W | 11.6 | 129.5 |
| 1986 | W | 51.2 | 82.2 | 10.8 | 80.9 | 13.2 | 28.5 | W | 9.2 | 19.7 | 45.7 | 24.6 |
| 1987 | W | 22.0 | 15.9 | 4.8 | 59.5 | 30.5 | 14.4 | 75.8 | 11.1 | 10.6 | 8.1 | 9.4 |
| 1988 | 7.2 | 13.4 | 15.5 | 13.0 | 18.4 | 22.3 | 21.3 | 68.3 | 20.0 | 11.8 | 17.5 | 18.7 |
| 1989 | W | 18.0 | 38.0 | 63.8 | 53.2 | 50.8 | 38.7 | 40.1 | 31.2 | 26.1 | 33.1 | 23.8 |
| 1990 | 55.6 | 32.1 | 47.7 | 33.6 | 10.7 | 61.6 | 27.1 | 41.4 | 30.6 | 54.6 | 38.8 | 24.6 |
| 1991 | 27.4 | 28.2 | 39.9 | W | W | 40.1 | 28.0 | 21.6 | 17.7 | 30.6 | 17.4 | 16.1 |
| 1992 | 19.8 | 14.6 | 26.9 | 29.7 | 24.1 | 24.1 | 36.3 | 22.9 | 44.2 | 120.1 | 56.3 | 89.5 |
| 1993 | 55.3 | 90.3 | 84.7 | 65.4 | 64.7 | 65.2 | 61.5 | 62.1 | 54.2 | 51.1 | 48.5 | 66.0 |
| 1994 | 71.4 | 42.5 | 51.1 | 64.5 | 44.4 | 54.6 | 45.9 | 59.7 | 51.1 | 48.3 | 55.7 | 64.8 |
| 1995 | 49.2 | 52.4 | 54.5 | 60.4 | 69.6 | 76.7 | 65.9 | 79.2 | 79.7 | 66.0 | 61.6 | 64.5 |
| 1996 | 48.8 | 252.2 | 39.4 | 46.6 | 59.5 | 52.1 | 42.5 | 52.6 | 52.1 | 61.3 | 56.1 | 42.2 |
| 1997 | 46.7 | 39.6 | 81.2 | 111.6 | 46.4 | 127.3 | 37.7 | 45.5 | 51.7 | 40.3 | 39.7 | 61.5 |
| 1998 | 50.6 | 52.6 | 63.6 | 62.9 | 54.5 | 403.5 | 123.3 | 90.9 | 82.8 | 137.7 | 62.3 | 73.5 |
| 1999 | 253.9 | 244.3 | 269.6 | 207.6 | 232.6 | 211.9 | 188.0 | 217.0 | 307.1 | 338.8 | 223.9 | 294.0 |
| 2000 | 301.0 | 451.0 | 164.2 | 174.0 | 336.1 | 119.4 | 111.1 | 50.9 | 58.5 | 82.8 | 74.4 | 34.2 |
| 2001 | 42.8 | 94.3 | 30.5 | 33.4 | 83.8 | 121.8 | 66.0 | 60.7 | 31.7 | 36.6 | 28.3 | 25.6 |
| 2002 | 25.2 | 23.9 | 26.1 | 24.6 | 24.0 | W | 26.7 | 22.8 | 20.8 | 25.1 | 33.1 | 20.1 |
| 2003 | W | 28.0 | W | 13.6 | 15.3 | 29.5 | W | W | 13.8 | 21.4 | 19.7 | 12.5 |
| 2004 | 24.9 | 22.2 | 26.6 | 27.3 | 28.2 | 34.9 | 104.2 | 32.5 | 42.7 | 30.6 | 276.4 | 114.1 |
| 2005 | 31.7 | 29.0 | 20.4 | 36.1 | 41.2 | 138.3 | 57.4 | 59.1 | 52.4 | 141.6 | 37.6 | 145.5 |
| 2006 | 29.2 | 34.8 | 34.1 | 33.9 | 32.5 | 41.3 | 30.9 | 48.9 | 34.9 | 30.4 | 129.8 | 126.3 |
| 2007 | 26.5 | 28.0 | 34.9 | 27.7 | 30.3 | 266.1 | 47.5 | 137.3 | 33.8 | 122.4 | 35.2 | 117.9 |
| 2008 | 149.6 | W | 245.2 | 45.9 | 216.0 | 209.1 | 317.9 | 181.0 | 362.8 | 84.3 | W | W |
| 2009 | 22.9 | 33.0 | 29.1 | 21.8 | 23.7 | 195.2 | 27.1 | 42.9 | 26.9 | 23.0 | 22.6 | 167.9 |
| 2010 | 129.0 | 84.5 | 175.6 | W | W | W | 102.2 | W | W | W | W | W |
| 2011 | W | W | W | W | W | W | W | W | W | W | W | W |
| 2012 | W | W | W | W | W | W | W | W | W | W | W | W |
| 2013 | W | W | W | W | W | W | 496.3 | 366.8 | W | W | W | W |
| 2014 | W | W | W | 494.7 | W | W | W | W | W | W | W | W |
| 2015 | W | W | W | W | W | W | W | W | W | W | W | W |
| 2016 | W | W | W | W | W | W | W | 357.5 | W | W | W | W |
| 2017 | W | W | W | 501.3 | 487.0 | 522.4 | 458.9 | 914.7 | 858.8 | 809.6 | 677.7 | 800.3 |
| 2018 | 819.0 | 769.3 | 758.2 | 729.7 | 831.6 | 732.0 | 539.6 | 514.7 | 549.3 | 773.3 | 672.5 | 451.6 |
| 2019 | 445.2 | 458.7 | 557.5 | 571.3 | 574.4 | 570.8 | 769.7 | 1,087.8 | 987.6 | 894.5 | W | 1,079.0 |
| 2020 | 992.3 | 882.3 | 736.1 | W | W | W | W | W | W | W | W | W |
| 2021 | W | W | W | W | W | W | W | 582.0 | 444.9 | W | W | W |
| 2022 | W | 562.6 | 417.5 | |||||||||
| - = No Data Reported; -- = Not Applicable; NA = Not Available; W = Withheld to avoid disclosure of individual company data. |
| Release Date: 6/1/2022 |
| Next Release Date: TBD |