|
Download Data (XLS File) |
|
||||||||
|
||||||||
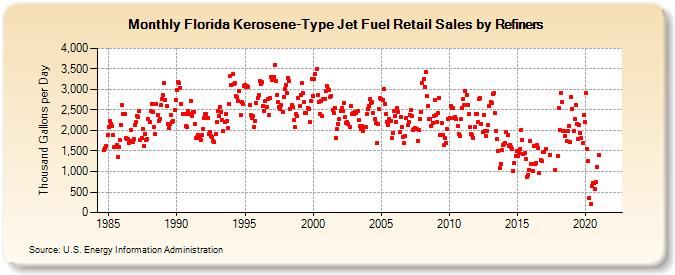
| Florida Kerosene-Type Jet Fuel Retail Sales by Refiners (Thousand Gallons per Day) | ||||||||
| Year | Jan | Feb | Mar | Apr | May | Jun | Jul | Aug | Sep | Oct | Nov | Dec |
|---|---|---|---|---|---|---|---|---|---|---|---|---|
| 1984 | 1,523.5 | 1,573.8 | 1,616.6 | 1,891.5 | ||||||||
| 1985 | 2,089.8 | 2,235.1 | 2,151.9 | 2,102.0 | 1,900.4 | 1,599.4 | 1,592.4 | 1,643.5 | 1,362.7 | 1,601.2 | 1,775.1 | 2,140.3 |
| 1986 | 2,611.5 | 2,412.4 | 2,400.3 | 1,822.6 | 1,785.2 | 1,800.3 | 1,691.5 | 1,752.9 | 2,008.6 | 1,714.2 | 1,788.6 | 2,122.0 |
| 1987 | 2,199.4 | 2,348.0 | 2,316.2 | 2,466.6 | 1,757.4 | 1,821.6 | 2,039.7 | 1,633.2 | 1,920.4 | 1,776.5 | 1,785.6 | 2,277.3 |
| 1988 | 2,198.6 | 2,475.7 | 2,651.9 | 2,453.0 | 2,083.1 | 1,904.3 | 2,644.7 | 2,379.9 | 2,226.3 | 2,286.9 | 2,611.8 | 2,778.7 |
| 1989 | 2,861.1 | 3,156.4 | 2,747.6 | 2,596.0 | 2,162.9 | 2,064.5 | 2,147.7 | 2,370.1 | 2,199.6 | 2,228.8 | 2,502.2 | 2,749.8 |
| 1990 | 2,985.7 | 3,187.5 | 3,159.0 | 3,038.0 | 2,641.8 | 2,409.3 | 2,402.4 | 2,403.7 | 2,097.6 | 2,095.0 | 2,463.0 | 2,409.0 |
| 1991 | 2,728.9 | 2,360.0 | 2,441.7 | 2,460.3 | 2,158.1 | 1,810.8 | 1,830.6 | 1,884.5 | 1,818.4 | 1,755.8 | 1,882.9 | 2,034.5 |
| 1992 | 2,293.6 | 2,406.2 | 2,412.5 | 2,310.7 | 1,922.2 | 1,965.6 | 1,876.6 | 1,831.5 | 1,751.2 | 1,724.2 | 1,906.6 | 2,203.0 |
| 1993 | 2,475.5 | 2,341.1 | 2,566.8 | 2,438.4 | 2,245.4 | 1,985.7 | 2,207.3 | 2,389.7 | 2,240.6 | 2,061.4 | 2,645.0 | 3,334.7 |
| 1994 | 3,113.4 | 3,370.8 | 3,129.7 | 3,150.1 | 2,840.5 | 2,807.1 | 2,713.5 | 2,954.1 | 2,386.2 | 2,696.8 | 2,644.1 | 3,090.5 |
| 1995 | 3,105.9 | 3,048.9 | 3,072.5 | 3,059.4 | 2,629.3 | 2,369.8 | 2,308.1 | 2,356.1 | 2,073.9 | 2,239.2 | 2,681.5 | 2,788.1 |
| 1996 | 2,873.8 | 3,200.0 | 3,136.4 | 3,174.4 | 2,599.6 | 2,476.2 | 2,718.9 | 2,578.7 | 2,769.9 | 2,377.8 | 2,795.0 | 3,300.7 |
| 1997 | 3,235.4 | 3,311.7 | 3,602.7 | 3,200.2 | 2,876.1 | 2,695.5 | 2,561.8 | 2,530.8 | 2,623.7 | 2,462.0 | 2,826.7 | 3,020.9 |
| 1998 | 3,116.9 | 2,905.4 | 3,283.2 | 3,208.6 | 2,526.3 | 2,623.3 | 2,562.3 | 2,243.7 | 2,075.6 | 2,405.2 | 2,343.9 | 2,790.5 |
| 1999 | 2,594.3 | 2,865.5 | 3,150.5 | 2,915.2 | 2,702.9 | 2,426.1 | 2,415.2 | 2,552.3 | 2,513.5 | 2,209.8 | 2,725.7 | 3,255.9 |
| 2000 | 2,835.7 | 3,260.2 | 3,377.7 | 3,503.5 | 2,875.0 | 2,689.4 | 2,410.0 | 2,712.8 | 2,345.6 | 2,773.5 | 2,773.9 | 2,956.1 |
| 2001 | 3,083.6 | 3,001.7 | 2,985.5 | 2,815.2 | 2,846.1 | 2,491.5 | 2,436.1 | 2,555.8 | 1,817.6 | 2,032.3 | 2,155.3 | 2,275.6 |
| 2002 | 2,474.5 | 2,551.0 | 2,483.6 | 2,667.2 | 2,331.0 | 2,187.8 | 2,197.2 | 2,147.8 | 2,088.8 | 2,592.3 | 2,400.9 | 2,416.3 |
| 2003 | 2,394.4 | 2,441.4 | 2,417.8 | 2,483.7 | 2,247.1 | 2,102.5 | 2,035.7 | 2,118.5 | 1,978.2 | 2,088.2 | 2,078.9 | 2,410.6 |
| 2004 | 2,522.2 | 2,589.8 | 2,756.7 | 2,671.1 | 2,693.0 | 2,433.6 | 2,278.3 | 2,172.3 | 1,683.0 | 2,167.7 | 2,523.0 | 2,781.9 |
| 2005 | 2,767.8 | 2,747.0 | 3,011.8 | 2,648.6 | 2,392.1 | 2,204.3 | 2,144.5 | 2,283.3 | 2,227.0 | 1,805.5 | 1,937.8 | 2,469.3 |
| 2006 | 2,359.8 | 2,216.5 | 2,545.7 | 2,458.4 | 1,958.1 | 2,333.9 | 2,092.7 | 1,843.8 | 1,698.9 | 1,873.5 | 2,311.7 | 2,127.8 |
| 2007 | 2,217.6 | 2,382.0 | 2,499.5 | 2,344.8 | 2,021.4 | 2,037.0 | 2,049.4 | 2,026.4 | 1,743.7 | 2,003.2 | 2,277.6 | 2,459.3 |
| 2008 | 3,150.8 | 3,243.5 | 3,059.2 | 3,423.6 | 2,830.4 | 2,600.8 | 2,271.1 | 2,285.2 | 2,103.5 | 2,193.9 | 2,346.6 | 2,733.1 |
| 2009 | 2,380.5 | 2,203.8 | 2,416.1 | 2,796.3 | 1,887.4 | 2,189.7 | 1,879.3 | 1,641.9 | 1,810.0 | 1,686.8 | 2,039.6 | 2,271.3 |
| 2010 | 2,313.2 | 2,606.6 | 2,556.8 | 2,539.2 | 2,299.0 | 2,325.5 | 2,268.5 | 2,118.3 | 1,917.0 | 1,875.8 | 2,269.0 | 2,541.2 |
| 2011 | 2,762.3 | 2,622.2 | 2,973.3 | 2,873.2 | 2,626.9 | 2,404.0 | 2,075.8 | 1,916.0 | 1,895.7 | 1,813.7 | 2,096.4 | 2,398.5 |
| 2012 | 2,406.5 | 2,199.9 | 2,767.0 | 2,791.3 | 2,151.7 | 1,973.6 | 2,367.8 | 1,995.9 | 1,859.0 | 1,988.9 | 2,132.7 | 2,596.1 |
| 2013 | 2,694.1 | 2,668.3 | 2,895.5 | 2,921.8 | 2,421.4 | 1,981.6 | 1,782.9 | 1,502.9 | 1,076.6 | 1,180.0 | 1,515.7 | 1,638.5 |
| 2014 | 1,661.7 | 1,706.1 | 1,950.7 | 1,879.6 | 1,621.7 | 1,653.8 | 1,608.2 | 1,554.8 | 1,021.1 | 1,202.4 | 1,372.1 | 1,489.6 |
| 2015 | 1,366.6 | 1,457.9 | 1,542.5 | 2,016.6 | 1,779.8 | 1,417.1 | 1,455.6 | 1,306.2 | 873.6 | 916.8 | 1,043.7 | 1,745.5 |
| 2016 | 1,183.1 | 1,014.8 | 1,614.6 | 1,184.1 | 1,212.9 | 1,656.0 | 1,582.2 | 961.5 | 1,287.4 | 1,254.7 | 1,464.1 | 1,466.6 |
| 2017 | W | 1,539.0 | W | W | 1,406.9 | W | W | W | NA | 1,027.1 | W | 1,379.0 |
| 2018 | 2,536.9 | 2,009.8 | 2,922.1 | 2,697.3 | 1,983.4 | 1,981.6 | 1,875.5 | 1,740.1 | 1,981.0 | 2,103.9 | 1,723.3 | 2,813.9 |
| 2019 | 2,534.3 | 1,979.0 | 2,268.2 | 2,632.0 | 2,169.1 | 1,782.9 | 2,136.8 | 1,927.9 | 1,817.4 | 1,684.3 | 2,381.2 | 2,215.4 |
| 2020 | 2,908.5 | 1,556.3 | 1,249.7 | 357.4 | 200.4 | 642.6 | 720.5 | 711.5 | 567.5 | 735.2 | 1,103.7 | 1,410.9 |
| 2021 | W | W | W | W | W | W | W | W | W | W | W | W |
| 2022 | W | W | W | |||||||||
| - = No Data Reported; -- = Not Applicable; NA = Not Available; W = Withheld to avoid disclosure of individual company data. |
| Release Date: 6/1/2022 |
| Next Release Date: TBD |