|
Download Data (XLS File) |
|
||||||||
|
||||||||
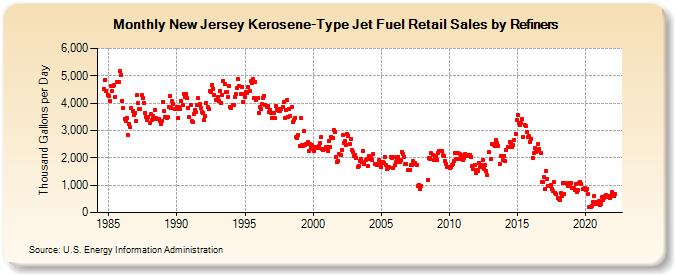
| New Jersey Kerosene-Type Jet Fuel Retail Sales by Refiners (Thousand Gallons per Day) | ||||||||
| Year | Jan | Feb | Mar | Apr | May | Jun | Jul | Aug | Sep | Oct | Nov | Dec |
|---|---|---|---|---|---|---|---|---|---|---|---|---|
| 1984 | 4,519.8 | 4,856.5 | 4,437.7 | 4,311.9 | ||||||||
| 1985 | 4,269.4 | 4,091.4 | 4,640.5 | 4,432.2 | 4,622.8 | 4,652.4 | 4,239.2 | 4,772.1 | 4,784.7 | 4,778.8 | 5,169.1 | 5,037.1 |
| 1986 | 4,077.4 | 3,839.4 | 3,424.0 | 3,340.9 | 3,452.1 | 2,837.3 | 3,224.2 | 3,111.9 | 3,814.5 | 3,721.7 | 3,576.2 | 3,656.6 |
| 1987 | 3,331.1 | 4,278.8 | 3,994.3 | 3,770.7 | 3,793.7 | 4,311.6 | 4,173.0 | 4,010.6 | 3,645.5 | 3,502.2 | 3,374.1 | 3,486.7 |
| 1988 | 3,287.6 | 3,591.7 | 3,374.6 | 3,541.5 | 3,426.9 | 3,741.9 | 3,445.5 | 3,406.6 | 3,431.4 | 3,342.2 | 3,241.8 | 3,338.0 |
| 1989 | 4,058.1 | 3,699.3 | 3,478.4 | 3,468.7 | 3,475.6 | 3,873.5 | 4,272.3 | 3,834.8 | 4,065.4 | 3,970.0 | 3,781.6 | 3,801.3 |
| 1990 | 3,860.9 | 3,463.1 | 3,861.3 | 3,787.7 | 4,076.3 | 3,913.3 | 4,350.1 | 4,214.9 | 4,331.0 | 4,174.6 | 3,835.1 | 3,500.8 |
| 1991 | 3,944.9 | 3,331.9 | 3,311.1 | 3,590.0 | 3,738.5 | 3,666.0 | 3,916.0 | 4,169.1 | 3,969.1 | 3,834.5 | 3,670.6 | 3,640.2 |
| 1992 | 3,390.0 | 3,513.4 | 4,016.9 | 3,841.4 | 3,802.0 | 4,424.6 | 4,398.9 | 4,647.1 | 4,529.8 | 4,289.3 | 4,121.9 | 4,127.6 |
| 1993 | 4,237.3 | 4,089.7 | 4,451.8 | 4,001.0 | 4,301.4 | 4,808.3 | 4,703.2 | 4,403.1 | 4,408.3 | 4,238.9 | 4,615.5 | 3,867.8 |
| 1994 | 3,809.0 | 3,913.7 | 3,939.4 | 4,237.8 | 4,331.1 | 4,538.1 | 4,879.3 | 4,610.6 | 4,334.5 | 4,579.9 | 4,044.7 | 4,343.8 |
| 1995 | 4,225.8 | 4,411.0 | 4,357.0 | 4,587.4 | 4,435.5 | 4,797.5 | 4,727.8 | 4,878.8 | 4,190.3 | 4,788.8 | 4,105.2 | 4,181.9 |
| 1996 | 3,646.6 | 3,857.6 | 3,792.1 | 3,972.7 | 4,200.1 | 4,266.7 | 3,930.8 | 3,853.9 | 3,888.8 | 3,673.5 | 3,765.2 | 3,632.5 |
| 1997 | 3,469.9 | 3,654.3 | 3,463.8 | 3,881.0 | 3,759.3 | 3,782.9 | 3,720.5 | 3,716.7 | 3,801.7 | 3,848.7 | 4,034.4 | 3,468.5 |
| 1998 | 3,732.3 | 4,115.2 | 3,489.0 | 3,788.9 | 3,514.2 | 3,842.9 | 3,301.3 | 3,376.2 | 3,466.2 | 2,750.6 | 2,718.4 | 2,819.1 |
| 1999 | 2,450.4 | 3,442.4 | 2,462.4 | 2,448.4 | 2,963.3 | 2,473.0 | 2,504.5 | 2,584.2 | 2,241.9 | 2,490.6 | 2,407.6 | 2,454.7 |
| 2000 | 2,331.5 | 2,256.3 | 2,405.0 | 2,358.2 | 2,372.6 | 2,420.0 | 2,530.3 | 2,743.5 | 2,337.3 | 2,293.5 | 2,306.3 | 2,398.5 |
| 2001 | 2,381.4 | 2,242.1 | 2,616.6 | 2,406.1 | 2,779.6 | 2,723.0 | 3,012.6 | 2,942.5 | 2,024.9 | 1,853.7 | 1,887.4 | 2,125.5 |
| 2002 | 2,113.3 | 2,291.4 | 2,843.5 | 2,544.8 | 2,627.3 | 2,487.4 | 2,886.4 | 2,810.2 | 2,516.3 | 2,701.3 | 2,269.0 | 2,213.0 |
| 2003 | 2,065.7 | 2,109.4 | 1,991.4 | 1,678.0 | 1,706.7 | 1,870.2 | 1,968.1 | 1,831.3 | 2,256.0 | 1,792.3 | 1,926.2 | 1,961.9 |
| 2004 | 1,687.2 | 2,061.9 | 1,951.2 | 1,985.0 | 1,924.8 | 2,146.2 | 1,779.9 | 1,778.0 | 1,743.9 | 1,720.5 | 1,910.6 | 1,759.6 |
| 2005 | 1,680.9 | 1,859.1 | 1,827.4 | 2,021.6 | 1,730.2 | 1,583.4 | 1,612.9 | 1,655.7 | 2,035.7 | 1,994.9 | 1,617.2 | 2,015.0 |
| 2006 | 1,731.1 | 1,848.1 | 1,924.8 | 2,047.2 | 1,851.6 | 1,903.4 | 2,218.6 | 2,132.3 | 2,032.5 | 1,771.6 | 1,770.7 | 1,550.6 |
| 2007 | 1,546.5 | 1,538.6 | 1,740.1 | 1,723.8 | 1,873.2 | 1,778.6 | 1,809.3 | 1,730.9 | 952.9 | 1,024.5 | 872.6 | 961.6 |
| 2008 | W | W | W | W | W | 1,186.9 | 1,996.6 | 1,959.1 | 2,162.3 | 2,090.1 | 1,924.6 | 2,004.5 |
| 2009 | 2,049.6 | 1,927.3 | 2,193.6 | 2,236.5 | 2,252.5 | 2,246.4 | 2,088.3 | 2,076.2 | 1,874.4 | 1,776.3 | 1,663.6 | 1,682.3 |
| 2010 | 1,611.6 | 1,657.1 | 1,727.1 | 1,757.7 | 1,867.1 | 2,175.6 | 1,947.3 | 2,174.9 | 1,954.9 | 2,128.5 | 2,089.8 | 1,961.3 |
| 2011 | 1,916.6 | 1,988.8 | 2,146.4 | 2,082.2 | 2,080.2 | 2,117.9 | 2,110.3 | 2,042.8 | 1,692.1 | 1,575.2 | 1,749.9 | 1,463.1 |
| 2012 | 1,565.2 | 1,518.7 | 1,810.9 | 1,682.4 | 1,741.0 | 1,933.1 | 1,605.7 | 1,727.4 | 1,501.7 | 1,362.1 | W | 2,201.3 |
| 2013 | 1,972.9 | 2,521.8 | 2,494.2 | 2,477.5 | 2,444.1 | 2,660.1 | 2,524.8 | 2,448.5 | 1,789.9 | 2,074.2 | 2,081.4 | 1,910.6 |
| 2014 | 2,074.9 | 1,880.2 | 2,281.1 | 2,390.8 | 2,386.0 | 2,572.6 | 2,527.1 | 2,394.7 | 2,459.9 | 2,659.5 | 2,889.2 | 3,383.0 |
| 2015 | 3,552.2 | 3,265.8 | 3,211.4 | 3,267.9 | 3,423.4 | 2,774.4 | 3,190.6 | 3,157.5 | 2,942.5 | 2,743.9 | 2,781.1 | 2,580.3 |
| 2016 | 2,705.2 | 2,007.0 | 2,179.2 | 2,342.0 | 2,221.4 | 2,257.4 | 2,513.7 | 2,319.9 | 2,176.1 | 1,129.2 | 1,123.2 | 1,307.3 |
| 2017 | 849.4 | 1,525.4 | 1,238.3 | 982.2 | 960.1 | 1,003.1 | 867.6 | 799.0 | 1,099.0 | 722.5 | 681.0 | 550.1 |
| 2018 | 505.0 | 462.8 | 698.6 | 610.5 | 1,091.0 | 696.0 | 1,065.8 | 1,032.3 | 976.5 | 1,092.5 | 1,002.6 | 1,074.1 |
| 2019 | 901.1 | 905.3 | 826.4 | 1,038.4 | 747.4 | 831.5 | 1,090.7 | 1,110.8 | 1,053.1 | 854.8 | 868.6 | 906.3 |
| 2020 | 825.9 | 866.5 | 668.4 | 191.3 | 205.2 | 249.4 | 388.9 | 595.6 | 399.7 | 314.4 | 296.1 | 413.9 |
| 2021 | 287.9 | 330.9 | 574.8 | 453.9 | 540.6 | 600.7 | 634.3 | 582.1 | 594.7 | 549.1 | 596.0 | 753.8 |
| 2022 | 601.3 | 594.6 | 669.5 | |||||||||
| - = No Data Reported; -- = Not Applicable; NA = Not Available; W = Withheld to avoid disclosure of individual company data. |
| Release Date: 6/1/2022 |
| Next Release Date: TBD |