|
Download Data (XLS File) |
|
||||||||
|
||||||||
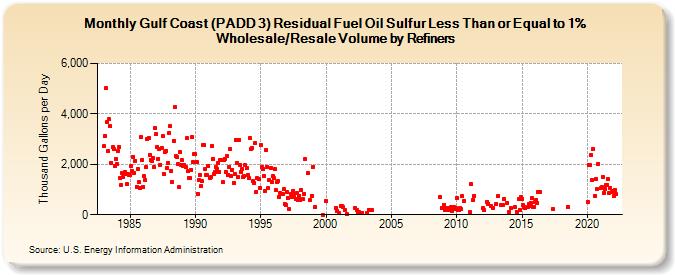
| Gulf Coast (PADD 3) Residual Fuel Oil Sulfur Less Than or Equal to 1% Wholesale/Resale Volume by Refiners (Thousand Gallons per Day) | ||||||||
| Year | Jan | Feb | Mar | Apr | May | Jun | Jul | Aug | Sep | Oct | Nov | Dec |
|---|---|---|---|---|---|---|---|---|---|---|---|---|
| 1983 | 2,711.3 | 3,130.3 | 5,017.8 | 3,662.7 | 2,516.2 | 3,784.7 | 3,510.5 | 2,067.7 | 2,682.1 | 2,610.1 | 1,913.6 | 2,219.7 |
| 1984 | 2,006.5 | 2,532.0 | 2,671.8 | 1,445.7 | 1,179.3 | 1,647.4 | 1,505.3 | 1,693.9 | 1,623.2 | 1,198.9 | 1,603.2 | 1,590.9 |
| 1985 | 1,561.1 | 1,941.9 | 1,727.9 | 2,299.5 | 1,656.5 | 2,148.8 | 1,112.1 | 1,816.4 | 1,284.3 | 1,049.6 | 3,070.7 | 2,186.7 |
| 1986 | 1,114.1 | 1,517.8 | 1,375.9 | 1,878.6 | 2,986.4 | 3,047.6 | 2,386.7 | 2,190.5 | 2,130.3 | 2,260.0 | 1,900.6 | 3,434.1 |
| 1987 | 3,202.0 | 2,678.6 | 2,227.9 | 2,599.5 | 1,979.0 | 2,657.7 | 3,132.7 | 1,618.1 | 2,479.2 | 2,545.1 | 1,865.1 | 2,068.7 |
| 1988 | 3,246.6 | 3,500.7 | 1,749.0 | 1,296.6 | 2,940.9 | 4,264.4 | 2,317.2 | 2,295.4 | 2,017.9 | 1,082.5 | 2,473.8 | 1,960.0 |
| 1989 | 2,156.7 | 1,923.3 | 1,988.7 | 1,880.8 | 3,028.8 | 1,724.6 | 1,453.4 | 1,444.6 | 1,793.4 | 3,064.0 | 2,085.4 | 2,413.8 |
| 1990 | 2,406.5 | 2,103.1 | 833.9 | 1,383.0 | 1,587.2 | 1,138.3 | 1,327.4 | 2,763.4 | 2,765.9 | 1,806.4 | 1,560.7 | 1,559.5 |
| 1991 | 1,934.6 | 1,464.0 | 1,483.5 | 2,731.3 | 2,215.3 | 1,613.1 | 1,676.2 | 1,875.3 | 1,809.7 | 2,048.1 | 1,700.8 | 2,154.7 |
| 1992 | 2,182.8 | 1,280.6 | 2,177.1 | 2,229.3 | 1,698.1 | 2,337.4 | 1,576.6 | 1,903.9 | 2,602.7 | 1,516.4 | 1,785.0 | 1,258.5 |
| 1993 | 1,617.4 | 2,958.0 | 2,060.1 | 1,506.9 | 2,968.0 | 1,973.1 | 1,707.1 | 1,828.1 | 1,503.8 | 1,516.9 | 1,953.8 | 1,834.8 |
| 1994 | 1,592.2 | 1,447.4 | 3,037.6 | 2,620.9 | 2,634.2 | 1,341.3 | 1,273.2 | 2,844.6 | 918.0 | 1,442.5 | 1,405.3 | 1,061.5 |
| 1995 | 2,772.8 | 1,890.2 | 1,808.2 | 1,540.0 | 925.5 | 2,574.2 | 1,910.7 | 1,054.8 | 1,379.3 | 1,844.8 | 1,311.6 | 1,523.9 |
| 1996 | 1,445.2 | 1,805.8 | 973.4 | 1,285.0 | 1,324.2 | 701.5 | 863.8 | 826.3 | 813.7 | 1,003.1 | 428.0 | 402.2 |
| 1997 | 889.9 | 657.6 | 215.4 | NA | 819.7 | 717.4 | 949.5 | 764.6 | 627.0 | 865.4 | 572.5 | 756.3 |
| 1998 | 568.7 | 982.7 | NA | 616.7 | 834.8 | 2,200.3 | W | 1,647.2 | W | 569.1 | W | 746.4 |
| 1999 | 1,894.5 | W | 305.3 | W | W | W | - | W | W | 6.9 | W | W |
| 2000 | 548.7 | W | W | W | W | W | W | W | W | 264.0 | 140.3 | W |
| 2001 | 60.2 | W | 349.2 | 337.4 | 291.7 | 184.3 | W | 13.0 | W | W | W | W |
| 2002 | W | W | W | 262.9 | 197.4 | 106.8 | 103.6 | W | W | 84.2 | W | W |
| 2003 | W | W | 71.6 | 204.7 | W | W | 204.5 | W | W | W | W | W |
| 2004 | W | W | W | W | W | W | W | W | W | W | W | W |
| 2005 | NA | NA | NA | W | W | W | W | W | W | W | W | W |
| 2006 | W | W | W | W | W | W | W | W | W | NA | NA | W |
| 2007 | W | W | W | W | W | W | W | W | W | W | W | W |
| 2008 | W | W | W | W | W | W | W | W | W | 693.1 | 281.6 | W |
| 2009 | 402.9 | 181.7 | 264.4 | 183.5 | 256.0 | 173.0 | 237.9 | 313.2 | 166.3 | 303.7 | 232.2 | 252.3 |
| 2010 | 674.5 | 203.0 | 176.8 | 271.4 | 213.5 | 739.3 | W | 538.3 | W | W | W | W |
| 2011 | 104.7 | 1,209.8 | W | 597.0 | 747.4 | W | W | W | W | W | W | W |
| 2012 | 275.7 | 183.5 | NA | W | 517.0 | 435.6 | W | 350.1 | W | 278.4 | W | W |
| 2013 | 416.5 | W | 742.4 | W | W | 384.6 | 387.5 | 619.1 | W | W | 465.0 | W |
| 2014 | 110.6 | W | 256.5 | W | W | 315.2 | W | 126.5 | W | 622.3 | 191.6 | 702.5 |
| 2015 | 624.6 | 390.6 | 325.5 | 255.7 | W | 296.9 | 425.2 | 338.3 | 478.4 | 650.3 | 314.1 | 318.4 |
| 2016 | 523.5 | 582.6 | 482.3 | 917.5 | 914.6 | NA | W | W | W | W | W | W |
| 2017 | W | W | W | W | 229.8 | W | W | W | W | W | W | W |
| 2018 | W | W | W | W | W | W | 318.5 | W | W | W | W | W |
| 2019 | - | - | - | W | W | - | W | - | W | W | W | W |
| 2020 | 520.0 | 1,982.3 | 1,967.5 | 2,369.2 | 1,374.3 | 2,598.8 | W | 760.4 | 1,409.7 | 1,022.1 | 2,023.9 | W |
| 2021 | 1,049.8 | 1,087.0 | 1,501.9 | 874.6 | 1,039.7 | 1,176.7 | 1,189.6 | 1,413.8 | 858.9 | 1,061.1 | 881.9 | 923.5 |
| 2022 | 732.2 | 999.7 | 822.3 | |||||||||
| - = No Data Reported; -- = Not Applicable; NA = Not Available; W = Withheld to avoid disclosure of individual company data. |
| Release Date: 6/1/2022 |
| Next Release Date: TBD |