|
Download Data (XLS File) |
|
||||||||
|
||||||||
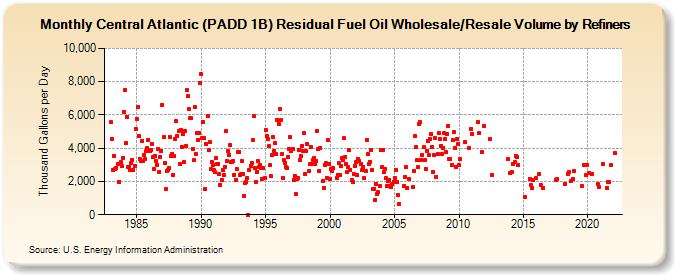
| Central Atlantic (PADD 1B) Residual Fuel Oil Wholesale/Resale Volume by Refiners (Thousand Gallons per Day) | ||||||||
| Year | Jan | Feb | Mar | Apr | May | Jun | Jul | Aug | Sep | Oct | Nov | Dec |
|---|---|---|---|---|---|---|---|---|---|---|---|---|
| 1983 | 5,563.1 | 4,578.9 | 2,708.6 | 3,553.1 | 2,772.1 | 2,817.8 | W | 3,025.4 | 1,984.0 | 3,160.5 | 2,911.1 | 3,407.4 |
| 1984 | 6,195.9 | 7,511.7 | 4,283.2 | 5,898.5 | 2,852.3 | 2,893.4 | 2,668.2 | 3,089.0 | 3,313.7 | 2,712.0 | 2,920.3 | 5,168.4 |
| 1985 | 5,778.0 | 6,504.8 | 4,707.2 | 3,353.3 | 3,239.8 | 4,448.1 | 3,222.2 | 3,567.5 | 3,364.1 | 3,823.8 | 4,019.8 | 4,506.9 |
| 1986 | 3,840.4 | 3,865.1 | 4,261.3 | 3,448.2 | 2,721.2 | 3,515.0 | 3,237.5 | 2,966.5 | 3,944.8 | 2,579.0 | 3,470.1 | 3,854.8 |
| 1987 | 6,615.6 | 4,646.0 | 3,102.6 | 1,551.4 | 2,657.5 | 2,664.0 | 2,783.9 | 4,681.1 | 3,539.0 | 3,675.5 | 2,395.7 | 3,506.1 |
| 1988 | 4,568.9 | 5,608.5 | 4,731.9 | 5,040.2 | 3,068.7 | 5,108.9 | 4,081.7 | 4,858.5 | 3,157.8 | 5,004.8 | 4,135.0 | 7,478.4 |
| 1989 | 7,123.8 | 6,338.4 | 5,813.0 | 5,801.9 | 3,966.5 | 3,268.2 | 6,450.8 | 3,664.8 | 4,886.4 | 4,521.7 | 4,926.5 | 7,925.8 |
| 1990 | 8,462.2 | 4,594.7 | 5,564.3 | 4,618.9 | 1,566.7 | 4,264.9 | 5,956.7 | 3,872.3 | 4,342.1 | 2,756.9 | 3,170.2 | 2,996.6 |
| 1991 | 2,665.5 | 2,552.3 | 3,379.9 | 3,030.1 | 3,071.3 | 2,476.6 | 1,787.3 | 2,114.7 | 2,707.1 | 2,391.0 | 2,875.9 | 5,012.9 |
| 1992 | 3,220.7 | 3,808.9 | 3,601.0 | 4,173.2 | 3,148.4 | 3,140.3 | 3,242.8 | 2,396.9 | 2,099.7 | 2,760.3 | 3,756.5 | 3,765.7 |
| 1993 | 2,360.4 | 2,442.9 | 3,226.8 | 2,444.1 | 1,105.6 | 1,889.9 | 1,964.3 | 2,211.4 | 0.0 | 2,665.9 | 2,931.1 | 3,132.5 |
| 1994 | 4,487.5 | 5,938.5 | 2,806.5 | 1,990.8 | 2,580.4 | 3,229.7 | 2,871.6 | 2,980.2 | 2,825.9 | 2,153.8 | 2,779.0 | 2,234.5 |
| 1995 | 5,117.1 | 4,747.1 | 4,568.2 | 4,112.6 | 2,968.4 | 2,320.4 | 3,599.2 | 4,688.1 | 3,851.1 | 4,292.2 | 3,637.4 | 5,696.7 |
| 1996 | 5,465.5 | 6,358.3 | 5,707.2 | 3,624.2 | 2,225.8 | 3,292.2 | 3,136.5 | 2,853.1 | 2,829.2 | 3,479.6 | 3,947.6 | 4,665.2 |
| 1997 | 3,817.5 | 3,957.0 | 2,080.5 | 2,348.8 | 1,259.4 | 2,158.5 | 2,222.3 | 3,913.4 | 3,306.6 | 3,501.7 | 4,152.5 | 3,815.2 |
| 1998 | 4,891.6 | 2,429.4 | 3,821.8 | 4,258.6 | 2,598.6 | 3,030.2 | 4,077.7 | 3,057.6 | 3,280.1 | 3,383.5 | 3,067.0 | 3,256.9 |
| 1999 | 5,043.6 | 3,939.9 | 2,639.8 | 4,025.2 | W | 2,029.7 | 1,584.6 | 2,999.3 | 3,112.9 | 2,233.0 | 4,483.8 | 3,051.1 |
| 2000 | 2,167.3 | 2,772.7 | 2,639.8 | 2,804.2 | W | W | 2,226.6 | 2,407.9 | 3,092.4 | 2,359.2 | 2,908.3 | 3,380.3 |
| 2001 | 3,296.0 | 4,586.8 | 3,497.3 | 3,064.2 | 2,579.1 | 2,856.7 | 3,902.9 | 2,707.2 | 2,075.5 | 1,937.8 | 2,470.7 | 2,945.0 |
| 2002 | 3,149.0 | 2,390.2 | 3,359.7 | 3,225.4 | W | 3,054.9 | 2,686.8 | 2,858.2 | 2,209.8 | 2,658.1 | 4,506.4 | 3,647.1 |
| 2003 | 3,057.8 | 3,188.8 | 3,902.1 | 2,699.0 | 1,554.3 | 1,559.9 | 908.4 | 1,838.4 | 1,216.5 | 1,348.8 | 1,717.3 | 3,888.5 |
| 2004 | 2,863.2 | 3,890.5 | 2,597.5 | 2,764.0 | 2,189.0 | 1,707.7 | 2,036.6 | 2,111.1 | 1,718.8 | 1,644.6 | 1,852.1 | 1,991.1 |
| 2005 | 2,213.3 | 2,715.8 | 1,978.6 | 1,194.8 | 652.1 | W | W | W | W | 1,721.1 | 2,277.7 | 2,867.2 |
| 2006 | 1,628.0 | 2,138.3 | W | W | W | 1,652.7 | 2,634.1 | 4,710.8 | 4,097.0 | 3,260.5 | 2,853.9 | 5,482.0 |
| 2007 | 5,555.0 | 3,309.3 | 3,597.0 | 4,049.5 | 3,262.7 | 2,761.7 | 3,838.6 | 4,453.0 | 3,570.8 | 4,529.1 | 4,862.5 | 4,085.5 |
| 2008 | 2,583.3 | 3,566.8 | 4,609.6 | 2,272.6 | 3,628.0 | 4,888.9 | 4,566.6 | 4,151.6 | 3,654.9 | 4,028.0 | 4,885.3 | 4,560.8 |
| 2009 | 3,764.6 | 4,863.0 | 5,351.8 | 3,349.0 | 3,338.1 | 2,986.7 | 4,498.8 | 4,960.1 | 4,006.4 | 2,883.7 | 4,558.6 | 4,252.2 |
| 2010 | 2,977.7 | 3,369.8 | W | W | W | W | 4,347.0 | W | W | 4,005.8 | W | 5,162.4 |
| 2011 | 4,855.5 | W | W | W | W | W | 5,567.5 | 4,884.3 | W | 3,769.9 | W | 5,363.6 |
| 2012 | W | W | W | W | W | 4,522.4 | W | 2,407.0 | W | W | W | W |
| 2013 | W | W | W | W | W | W | W | W | W | W | 3,332.9 | 2,494.2 |
| 2014 | W | 2,581.2 | 3,056.0 | W | 3,159.0 | 3,522.6 | 3,478.1 | 2,996.9 | W | W | W | W |
| 2015 | W | 1,056.2 | W | W | W | W | 2,122.3 | 1,764.4 | 1,624.8 | 2,074.5 | W | W |
| 2016 | 2,182.3 | W | 2,431.8 | W | 1,797.9 | W | 1,604.5 | W | W | W | W | W |
| 2017 | W | W | W | W | W | W | 2,103.4 | 2,121.3 | W | W | W | W |
| 2018 | W | W | W | 1,833.2 | W | 2,474.7 | 2,565.8 | W | 2,040.2 | W | 2,130.1 | 2,626.8 |
| 2019 | W | W | W | W | W | W | 1,725.2 | W | 2,976.2 | W | 2,358.9 | 2,990.4 |
| 2020 | NA | 2,508.4 | W | W | 2,453.5 | W | W | W | W | 1,850.4 | 1,673.3 | W |
| 2021 | W | W | 3,068.6 | W | W | W | 1,578.7 | 1,960.1 | 1,936.9 | 2,979.9 | W | W |
| 2022 | W | 3,700.7 | W | |||||||||
| - = No Data Reported; -- = Not Applicable; NA = Not Available; W = Withheld to avoid disclosure of individual company data. |
| Release Date: 6/1/2022 |
| Next Release Date: TBD |