|
Download Data (XLS File) |
|
||||||||
|
||||||||
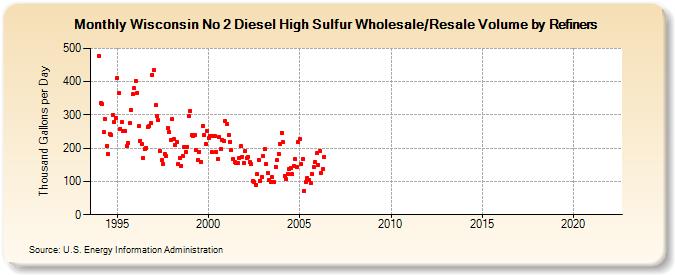
| Wisconsin No 2 Diesel High Sulfur Wholesale/Resale Volume by Refiners (Thousand Gallons per Day) | ||||||||
| Year | Jan | Feb | Mar | Apr | May | Jun | Jul | Aug | Sep | Oct | Nov | Dec |
|---|---|---|---|---|---|---|---|---|---|---|---|---|
| 1994 | 478.3 | 334.8 | 332.4 | 248.1 | 287.9 | 207.3 | 181.8 | 242.8 | 239.9 | 300.2 | 279.5 | 292.2 |
| 1995 | 411.1 | 365.7 | 259.0 | 278.5 | 250.4 | 251.2 | 205.4 | 215.4 | 275.2 | 315.2 | 362.1 | 379.9 |
| 1996 | 403.2 | 366.7 | 265.6 | 223.0 | 211.6 | 171.3 | 197.0 | 201.6 | 263.3 | 265.2 | 276.4 | 420.8 |
| 1997 | 434.6 | 328.4 | 296.5 | 283.8 | 191.0 | 163.2 | 152.5 | 183.4 | 175.4 | 259.5 | 247.4 | 224.1 |
| 1998 | 287.4 | 226.7 | 210.9 | 217.4 | 152.6 | 171.1 | 147.3 | 176.2 | 202.3 | 187.9 | 203.6 | 295.3 |
| 1999 | 312.3 | 239.4 | 237.5 | 239.3 | 194.5 | 165.8 | 189.8 | 159.7 | 266.7 | 238.3 | 213.1 | 252.4 |
| 2000 | 229.5 | 236.9 | 189.2 | 237.0 | 235.3 | 188.8 | 167.7 | 232.9 | 196.9 | 225.7 | 222.9 | 281.3 |
| 2001 | 273.1 | 240.0 | 219.4 | 193.5 | 167.7 | 157.8 | 156.4 | 155.9 | 170.4 | 205.3 | 174.4 | 155.9 |
| 2002 | 190.3 | 169.4 | 174.9 | 158.4 | 151.5 | 101.8 | 98.7 | 90.2 | 122.2 | 165.0 | 101.6 | 113.6 |
| 2003 | 176.2 | 196.1 | 153.5 | 123.9 | 103.1 | 98.4 | 113.2 | 99.8 | 144.1 | 163.6 | 183.6 | 213.4 |
| 2004 | 246.8 | 217.4 | 117.6 | 107.3 | 123.2 | 137.8 | 141.0 | 121.5 | 147.0 | 166.6 | 142.9 | 218.2 |
| 2005 | 229.1 | 151.7 | 167.7 | 72.0 | 98.8 | 110.9 | 105.4 | 94.5 | 123.3 | 143.2 | 157.9 | 184.3 |
| 2006 | 150.5 | 190.9 | 124.8 | 136.3 | 174.8 | W | W | W | W | W | W | W |
| 2007 | W | W | W | W | W | W | W | W | W | W | W | W |
| 2008 | W | W | W | W | W | W | W | W | W | W | W | W |
| 2009 | W | W | W | W | W | W | W | W | W | W | W | W |
| 2010 | W | W | W | W | W | - | - | - | - | - | - | - |
| 2011 | - | - | - | - | - | - | - | - | - | - | - | - |
| 2012 | - | - | - | - | - | - | - | - | - | - | - | - |
| 2013 | - | - | - | - | - | - | - | - | - | - | - | - |
| 2014 | - | - | - | - | - | - | - | - | - | - | - | - |
| 2015 | - | - | - | - | - | - | - | - | - | - | - | - |
| 2016 | - | - | - | - | - | - | - | - | - | - | - | - |
| 2017 | - | - | - | - | - | - | - | - | - | - | - | - |
| 2018 | - | - | - | - | - | - | - | - | - | - | - | - |
| 2019 | - | - | - | - | - | - | - | - | - | - | - | - |
| 2020 | - | - | - | - | - | - | - | - | - | - | - | - |
| 2021 | - | - | - | - | - | - | - | - | - | - | - | - |
| 2022 | - | - | - | |||||||||
| - = No Data Reported; -- = Not Applicable; NA = Not Available; W = Withheld to avoid disclosure of individual company data. |
| Release Date: 6/1/2022 |
| Next Release Date: TBD |