|
Download Data (XLS File) |
|
||||||||
|
||||||||
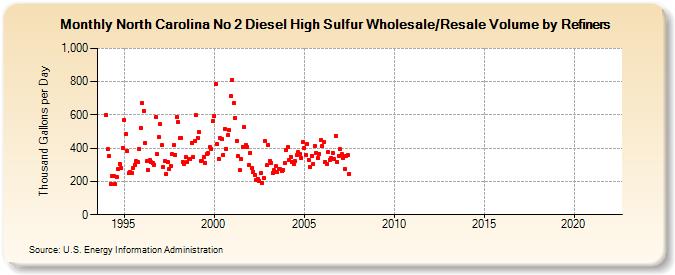
| North Carolina No 2 Diesel High Sulfur Wholesale/Resale Volume by Refiners (Thousand Gallons per Day) | ||||||||
| Year | Jan | Feb | Mar | Apr | May | Jun | Jul | Aug | Sep | Oct | Nov | Dec |
|---|---|---|---|---|---|---|---|---|---|---|---|---|
| 1994 | 601.1 | 392.3 | 352.7 | 183.4 | 230.6 | 230.6 | 182.9 | 227.5 | 272.6 | 303.8 | 282.5 | 401.5 |
| 1995 | 569.5 | 488.1 | 385.6 | 248.6 | 257.0 | 251.9 | 282.3 | 301.5 | 320.3 | 318.9 | 394.8 | 522.4 |
| 1996 | 671.2 | 625.8 | 433.5 | 321.4 | 271.8 | 328.5 | 315.4 | 313.6 | 301.8 | 588.4 | 363.2 | 466.4 |
| 1997 | 543.5 | 416.2 | 287.3 | 322.2 | 244.3 | 316.5 | 277.3 | 291.1 | 362.9 | 420.2 | 360.9 | 586.9 |
| 1998 | 558.8 | 459.1 | 461.1 | 316.9 | 304.4 | 344.3 | 315.6 | 336.8 | 333.7 | 433.1 | 348.2 | 441.9 |
| 1999 | 597.3 | 462.9 | 495.1 | 323.7 | 320.1 | 348.0 | 313.4 | 363.3 | 369.1 | 405.0 | 397.8 | 562.2 |
| 2000 | 591.8 | 785.4 | 422.5 | 335.5 | 460.2 | 452.9 | 359.2 | 517.6 | 396.9 | 477.7 | 509.1 | 712.7 |
| 2001 | 810.0 | 671.4 | 582.2 | 443.6 | 351.5 | 268.6 | 334.4 | 410.0 | 528.5 | 421.6 | 405.9 | 299.7 |
| 2002 | 373.2 | 282.1 | 258.4 | 237.1 | 210.6 | 217.1 | 205.2 | 249.9 | 191.8 | 222.1 | 440.8 | 296.0 |
| 2003 | 420.4 | 325.2 | 313.1 | 252.0 | 267.2 | 291.3 | 255.2 | 276.0 | 272.2 | 264.6 | 271.3 | 310.3 |
| 2004 | 390.9 | 406.5 | 331.2 | 349.0 | 316.5 | 303.5 | 321.0 | 358.2 | 374.7 | 365.0 | 343.0 | 435.2 |
| 2005 | 400.7 | 360.5 | 425.8 | 331.7 | 287.4 | 355.5 | 305.0 | 412.9 | 373.0 | 340.8 | 366.4 | 448.4 |
| 2006 | 414.2 | 440.0 | 317.1 | 306.1 | 375.7 | 331.3 | 342.3 | 373.7 | 332.9 | 473.7 | 318.1 | 353.9 |
| 2007 | 392.5 | 363.0 | 343.2 | 275.8 | 355.7 | 358.4 | 247.4 | W | W | W | - | - |
| 2008 | - | - | W | W | - | - | - | - | - | - | - | - |
| 2009 | - | - | - | - | - | - | - | - | - | - | - | - |
| 2010 | - | - | - | - | - | - | - | - | - | - | - | - |
| 2011 | - | - | - | - | - | - | - | - | - | - | - | - |
| 2012 | - | - | - | - | - | - | - | - | - | - | - | - |
| 2013 | - | - | - | - | - | - | - | - | - | - | - | - |
| 2014 | - | - | - | - | - | - | - | - | - | - | - | - |
| 2015 | - | - | - | - | - | - | - | - | - | - | - | - |
| 2016 | - | - | - | - | - | - | - | - | - | - | - | - |
| 2017 | - | - | - | - | - | - | - | - | - | - | - | - |
| 2018 | - | - | - | - | - | - | - | - | - | - | - | - |
| 2019 | - | - | - | - | - | - | - | - | - | - | - | - |
| 2020 | - | - | - | - | - | - | - | - | - | - | - | - |
| 2021 | - | - | - | - | - | - | - | - | - | - | - | - |
| 2022 | - | - | - | |||||||||
| - = No Data Reported; -- = Not Applicable; NA = Not Available; W = Withheld to avoid disclosure of individual company data. |
| Release Date: 6/1/2022 |
| Next Release Date: TBD |