|
Download Data (XLS File) |
|
||||||||
|
||||||||
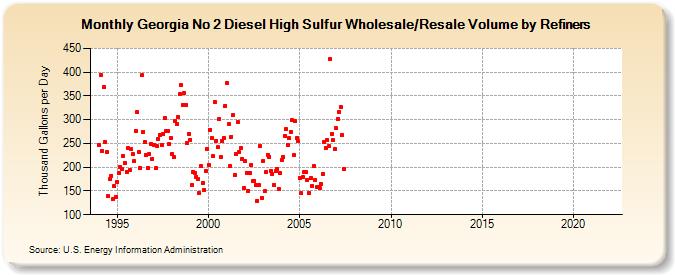
| Georgia No 2 Diesel High Sulfur Wholesale/Resale Volume by Refiners (Thousand Gallons per Day) | ||||||||
| Year | Jan | Feb | Mar | Apr | May | Jun | Jul | Aug | Sep | Oct | Nov | Dec |
|---|---|---|---|---|---|---|---|---|---|---|---|---|
| 1994 | 247.0 | 394.7 | 234.7 | 368.5 | 253.5 | 231.7 | 138.4 | 175.4 | 182.4 | 132.4 | 159.9 | 138.3 |
| 1995 | 169.7 | 187.5 | 199.4 | 195.5 | 223.5 | 209.5 | 190.2 | 239.5 | 193.3 | 238.8 | 227.9 | 212.0 |
| 1996 | 277.0 | 315.3 | 232.7 | 198.6 | 394.3 | 275.0 | 252.5 | 225.9 | 199.2 | 228.2 | 249.7 | 217.7 |
| 1997 | 247.7 | 197.6 | 245.1 | 259.4 | 268.6 | 246.7 | 270.9 | 303.3 | 276.6 | 276.8 | 248.8 | 261.9 |
| 1998 | 228.0 | 220.5 | 298.0 | 291.9 | 306.6 | 353.0 | 372.8 | 331.7 | 355.9 | 331.1 | 251.1 | 270.9 |
| 1999 | 258.0 | 163.5 | 190.0 | 188.8 | 179.8 | 174.8 | 145.5 | 202.9 | 166.4 | 153.0 | 192.1 | 238.4 |
| 2000 | 204.8 | 279.1 | 261.1 | 223.4 | 338.0 | 255.8 | 241.5 | 301.2 | 220.9 | 255.4 | 261.9 | 329.8 |
| 2001 | 377.6 | 290.3 | 202.3 | 264.2 | 309.8 | 183.4 | 228.6 | 295.5 | 231.8 | 239.8 | 218.2 | 157.0 |
| 2002 | 212.0 | 188.6 | 150.3 | 188.3 | 204.6 | 170.1 | 170.9 | 162.7 | 129.4 | 162.0 | 243.7 | 135.4 |
| 2003 | 212.9 | 148.9 | 190.5 | 226.3 | 222.1 | 192.6 | 185.9 | 163.1 | 192.2 | 196.5 | 154.9 | 187.3 |
| 2004 | 215.2 | 222.0 | 265.7 | 279.6 | 245.9 | 260.9 | 274.3 | 298.4 | 225.2 | 297.2 | 261.8 | 255.4 |
| 2005 | 178.1 | 144.8 | 179.2 | 189.4 | 189.0 | 173.8 | 145.3 | 176.6 | 161.2 | 202.7 | 173.0 | 157.4 |
| 2006 | 157.8 | 156.3 | 164.9 | 186.6 | 252.5 | 240.1 | 256.7 | 243.9 | 427.4 | 270.5 | 256.8 | 237.4 |
| 2007 | 281.5 | 301.7 | 316.2 | 325.7 | 267.4 | 195.2 | W | W | W | W | - | - |
| 2008 | - | - | - | W | - | - | - | - | - | - | - | - |
| 2009 | - | - | - | - | - | - | - | - | - | - | - | - |
| 2010 | - | - | - | - | - | - | - | - | - | - | - | - |
| 2011 | - | - | - | - | - | - | - | - | - | - | - | - |
| 2012 | - | - | - | - | - | - | - | - | - | - | - | - |
| 2013 | - | - | - | - | - | - | - | - | - | - | - | - |
| 2014 | - | - | - | - | - | - | - | - | - | - | - | - |
| 2015 | - | - | - | - | - | - | - | - | - | - | - | - |
| 2016 | - | - | - | - | - | - | - | - | - | - | - | - |
| 2017 | - | - | - | - | - | - | - | - | - | - | - | - |
| 2018 | - | - | - | - | - | - | - | - | - | - | - | - |
| 2019 | - | - | - | - | - | - | - | - | - | - | - | - |
| 2020 | - | - | - | - | - | - | - | - | - | - | - | - |
| 2021 | - | - | - | - | W | - | - | - | - | - | - | - |
| 2022 | - | - | - | |||||||||
| - = No Data Reported; -- = Not Applicable; NA = Not Available; W = Withheld to avoid disclosure of individual company data. |
| Release Date: 6/1/2022 |
| Next Release Date: TBD |