|
Download Data (XLS File) |
|
||||||||
|
||||||||
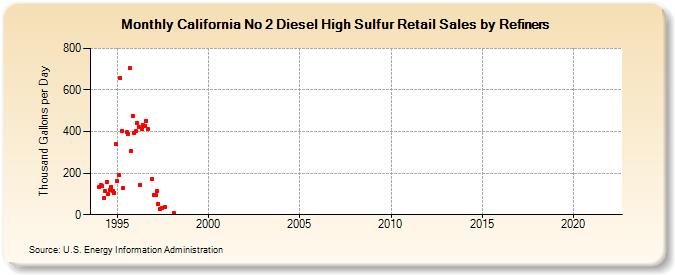
| California No 2 Diesel High Sulfur Retail Sales by Refiners (Thousand Gallons per Day) | ||||||||
| Year | Jan | Feb | Mar | Apr | May | Jun | Jul | Aug | Sep | Oct | Nov | Dec |
|---|---|---|---|---|---|---|---|---|---|---|---|---|
| 1994 | 133.5 | 144.0 | 138.9 | 79.5 | 115.7 | 156.2 | 101.6 | 119.6 | 133.8 | 114.6 | 106.8 | 338.4 |
| 1995 | 162.1 | 189.4 | 659.1 | 403.1 | 129.0 | W | 395.8 | 389.5 | 704.4 | 305.1 | 475.9 | 393.4 |
| 1996 | 401.4 | 440.4 | 421.6 | 144.8 | 412.3 | 430.3 | 426.7 | 452.5 | 410.0 | W | W | 169.5 |
| 1997 | 93.0 | 96.3 | 115.7 | 52.2 | 28.6 | 33.3 | W | 37.4 | W | W | W | W |
| 1998 | W | 8.5 | W | W | W | W | W | W | W | NA | - | W |
| 1999 | W | W | W | W | W | W | W | W | W | W | W | W |
| 2000 | W | W | W | W | W | W | W | W | W | W | W | W |
| 2001 | W | W | W | W | W | W | W | W | W | W | W | W |
| 2002 | W | W | W | W | W | W | W | W | W | W | W | W |
| 2003 | W | W | W | W | W | W | W | W | W | W | W | W |
| 2004 | W | W | W | W | W | W | W | W | W | W | W | W |
| 2005 | W | W | W | W | W | W | W | W | W | W | W | W |
| 2006 | W | W | W | W | W | W | W | W | W | W | W | W |
| 2007 | - | - | - | - | - | - | - | W | W | W | W | - |
| 2008 | W | - | - | - | - | - | - | - | - | - | - | - |
| 2009 | - | - | - | - | W | - | - | - | - | - | - | - |
| 2010 | - | - | W | W | W | - | - | - | - | - | - | - |
| 2011 | - | - | - | - | - | - | - | - | - | W | W | - |
| 2012 | W | - | W | W | W | W | - | W | W | W | W | W |
| 2013 | W | W | W | W | W | W | W | - | W | W | W | - |
| 2014 | W | W | W | W | W | W | W | W | W | W | W | W |
| 2015 | W | W | W | - | - | W | W | W | W | W | - | - |
| 2016 | - | - | - | - | - | - | - | - | - | - | - | - |
| 2017 | - | - | - | - | - | - | - | - | - | - | - | - |
| 2018 | - | - | - | - | - | - | - | - | - | - | - | - |
| 2019 | - | - | - | - | - | - | - | - | - | - | - | - |
| 2020 | - | - | - | - | - | - | - | - | - | - | - | - |
| 2021 | - | - | - | - | - | - | - | - | - | - | - | - |
| 2022 | - | - | - | |||||||||
| - = No Data Reported; -- = Not Applicable; NA = Not Available; W = Withheld to avoid disclosure of individual company data. |
| Release Date: 6/1/2022 |
| Next Release Date: TBD |