|
Download Data (XLS File) |
|
||||||||
|
||||||||
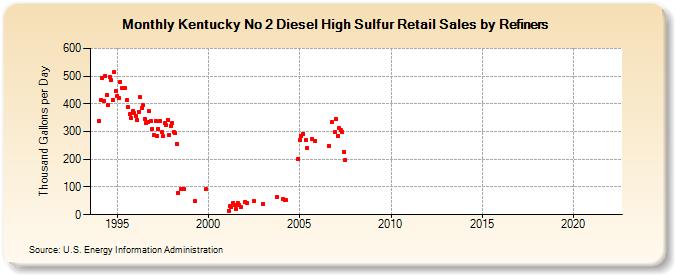
| Kentucky No 2 Diesel High Sulfur Retail Sales by Refiners (Thousand Gallons per Day) | ||||||||
| Year | Jan | Feb | Mar | Apr | May | Jun | Jul | Aug | Sep | Oct | Nov | Dec |
|---|---|---|---|---|---|---|---|---|---|---|---|---|
| 1994 | 339.6 | 414.3 | 492.8 | 411.0 | 501.3 | 431.4 | 396.1 | 496.6 | 484.9 | 415.4 | 514.6 | 445.6 |
| 1995 | 429.8 | 420.3 | 479.7 | 456.0 | 455.5 | 458.0 | 412.3 | 388.3 | 362.3 | 348.6 | 372.7 | 366.6 |
| 1996 | 356.4 | 340.8 | 372.0 | 422.9 | 383.3 | 394.6 | 344.8 | 331.0 | 335.1 | 373.2 | 337.9 | 310.9 |
| 1997 | 286.0 | 339.8 | 282.8 | 311.0 | 339.0 | 297.4 | 283.4 | 329.6 | 323.7 | 343.0 | 288.1 | 319.4 |
| 1998 | 332.1 | 299.9 | 295.3 | 256.4 | 79.5 | W | 91.0 | 94.2 | 92.6 | W | W | W |
| 1999 | W | W | W | 48.5 | W | W | W | W | W | W | 91.5 | W |
| 2000 | W | W | W | W | W | W | W | W | W | W | W | W |
| 2001 | W | 15.2 | 30.2 | 26.2 | 42.9 | 35.9 | 19.4 | 42.6 | 35.5 | 26.4 | W | W |
| 2002 | 46.5 | 43.5 | W | W | W | W | 50.2 | W | W | W | W | W |
| 2003 | 39.2 | W | W | W | W | W | W | W | W | 65.4 | W | W |
| 2004 | W | 55.0 | 54.2 | 53.0 | W | W | W | W | W | W | W | 202.1 |
| 2005 | 271.3 | 285.3 | 292.9 | W | 267.9 | 241.5 | W | W | 273.6 | W | 266.9 | W |
| 2006 | W | W | W | W | W | W | W | 248.8 | W | 333.1 | W | 298.7 |
| 2007 | 343.5 | 284.1 | 312.3 | 303.9 | 298.6 | 227.3 | 197.5 | W | W | W | - | - |
| 2008 | - | - | - | - | - | - | - | W | - | - | - | - |
| 2009 | - | - | - | - | - | - | - | - | - | - | - | - |
| 2010 | - | - | - | - | - | - | - | - | - | - | - | - |
| 2011 | - | - | - | - | - | - | - | - | - | - | - | - |
| 2012 | - | - | - | - | - | - | - | - | - | - | - | - |
| 2013 | - | - | - | - | - | - | - | - | - | - | - | - |
| 2014 | - | - | - | - | - | - | - | - | - | - | - | - |
| 2015 | - | - | - | - | - | - | - | - | - | - | - | - |
| 2016 | - | - | - | - | - | - | - | - | - | - | - | - |
| 2017 | - | - | - | - | - | - | - | - | - | - | - | - |
| 2018 | - | - | - | - | - | - | - | - | - | - | - | - |
| 2019 | - | - | - | - | - | - | - | - | - | - | - | - |
| 2020 | - | - | - | - | - | - | - | - | - | - | - | - |
| 2021 | - | - | - | - | - | - | - | - | - | - | - | - |
| 2022 | - | - | - | |||||||||
| - = No Data Reported; -- = Not Applicable; NA = Not Available; W = Withheld to avoid disclosure of individual company data. |
| Release Date: 6/1/2022 |
| Next Release Date: TBD |