|
Download Data (XLS File) |
|
||||||||
|
||||||||
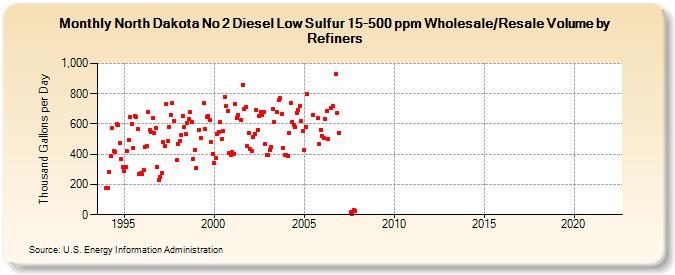
| North Dakota No 2 Diesel Low Sulfur 15-500 ppm Wholesale/Resale Volume by Refiners (Thousand Gallons per Day) | ||||||||
| Year | Jan | Feb | Mar | Apr | May | Jun | Jul | Aug | Sep | Oct | Nov | Dec |
|---|---|---|---|---|---|---|---|---|---|---|---|---|
| 1994 | 178.9 | 176.1 | 281.2 | 391.1 | 572.4 | 421.4 | 414.4 | 596.7 | 590.3 | 476.2 | 370.7 | 317.5 |
| 1995 | 289.4 | 315.7 | 422.3 | 491.9 | 644.4 | 600.6 | 444.3 | 654.8 | 649.0 | 568.2 | 269.3 | 276.5 |
| 1996 | 268.6 | 297.7 | 449.7 | 452.6 | 676.6 | 561.3 | 547.0 | 640.0 | 541.5 | 574.2 | 316.6 | 227.3 |
| 1997 | 246.8 | 277.4 | 478.0 | 452.2 | 733.8 | 487.0 | 583.1 | 659.7 | 737.7 | 617.7 | W | 359.0 |
| 1998 | 466.8 | 488.1 | 527.1 | 654.8 | 577.6 | 532.4 | 609.1 | 631.2 | 677.2 | 611.6 | 370.2 | 428.3 |
| 1999 | 310.8 | W | 563.2 | 505.3 | W | 737.6 | 565.4 | 647.9 | 656.0 | 626.9 | 478.1 | 404.1 |
| 2000 | 340.6 | 371.9 | 533.8 | 549.6 | 614.1 | 501.8 | 550.7 | 781.6 | 719.2 | 686.2 | 409.3 | 394.1 |
| 2001 | 414.2 | 403.8 | 732.5 | 640.9 | 659.5 | W | 627.8 | 860.4 | 697.6 | 712.6 | 452.6 | 539.4 |
| 2002 | 433.7 | 423.6 | 511.5 | 535.6 | 695.5 | 562.5 | 654.3 | 676.3 | 656.3 | 676.2 | 468.5 | 395.1 |
| 2003 | 392.7 | 428.5 | 446.9 | 701.7 | 610.1 | W | 678.3 | 756.6 | 768.6 | 663.2 | 441.2 | 396.6 |
| 2004 | 395.6 | 389.8 | 539.5 | 740.6 | 616.3 | 592.4 | 579.7 | 674.0 | 695.4 | 717.9 | 621.4 | 553.5 |
| 2005 | 429.0 | 582.9 | 795.7 | W | W | W | 660.3 | W | W | 640.2 | 464.5 | 561.1 |
| 2006 | 520.6 | 504.7 | 633.8 | 687.5 | 502.2 | W | 708.4 | 719.1 | W | 927.8 | 672.8 | 542.8 |
| 2007 | W | W | W | - | W | W | W | 14.9 | 7.2 | 32.2 | 26.1 | W |
| 2008 | W | W | W | W | W | W | W | W | W | W | W | W |
| 2009 | W | W | W | W | W | W | W | W | W | W | W | W |
| 2010 | W | W | W | W | W | - | W | - | - | - | - | - |
| 2011 | - | - | - | - | - | - | - | - | - | - | W | W |
| 2012 | W | - | - | W | - | - | - | - | - | - | - | - |
| 2013 | - | - | - | - | - | - | - | - | - | - | - | - |
| 2014 | - | - | - | - | - | - | - | - | - | - | - | - |
| 2015 | - | - | - | - | - | - | - | - | - | - | - | - |
| 2016 | - | - | - | - | - | - | - | - | - | - | - | - |
| 2017 | - | - | - | - | - | - | - | - | - | - | - | - |
| 2018 | - | - | - | - | - | - | - | - | - | - | - | - |
| 2019 | - | - | - | - | - | - | - | - | - | - | - | - |
| 2020 | - | - | - | - | - | - | - | - | - | - | - | - |
| 2021 | - | - | - | - | - | - | - | - | - | - | - | - |
| 2022 | - | - | - | |||||||||
| - = No Data Reported; -- = Not Applicable; NA = Not Available; W = Withheld to avoid disclosure of individual company data. |
| Release Date: 6/1/2022 |
| Next Release Date: TBD |