|
Download Data (XLS File) |
|
||||||||
|
||||||||
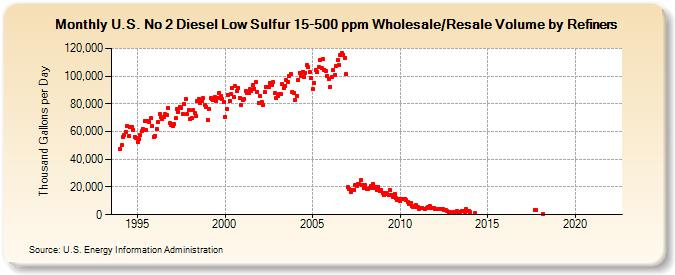
| U.S. No 2 Diesel Low Sulfur 15-500 ppm Wholesale/Resale Volume by Refiners (Thousand Gallons per Day) | ||||||||
| Year | Jan | Feb | Mar | Apr | May | Jun | Jul | Aug | Sep | Oct | Nov | Dec |
|---|---|---|---|---|---|---|---|---|---|---|---|---|
| 1994 | 47,268.5 | 50,111.1 | 55,927.1 | 57,738.4 | 59,828.0 | 64,212.3 | 56,489.3 | 63,480.3 | 63,110.1 | 61,301.6 | 56,294.8 | 55,418.7 |
| 1995 | 52,745.5 | 54,413.8 | 57,295.7 | 60,297.6 | 61,603.8 | 67,439.7 | 61,043.0 | 67,500.2 | 67,087.5 | 69,758.6 | 64,004.5 | 56,295.0 |
| 1996 | 57,015.7 | 61,870.5 | 67,247.8 | 72,899.5 | 70,222.0 | 69,198.0 | 70,696.2 | 72,389.8 | 71,610.5 | 76,965.1 | 66,101.3 | 64,657.0 |
| 1997 | 63,795.4 | 65,338.7 | 69,449.6 | 76,353.2 | 74,249.8 | 77,671.9 | 77,198.8 | 72,826.0 | 80,025.5 | 83,428.0 | 72,400.3 | 75,251.1 |
| 1998 | 68,866.5 | 69,563.6 | 75,204.1 | 73,388.5 | 71,560.2 | 82,219.5 | 83,381.3 | 80,626.2 | 81,960.8 | 83,887.7 | 78,857.4 | 77,782.0 |
| 1999 | 68,589.5 | 76,181.7 | 83,892.5 | 83,496.9 | 82,632.0 | 85,017.0 | 81,938.7 | 84,188.7 | 88,064.3 | 85,450.4 | 83,324.9 | 80,974.9 |
| 2000 | 70,827.6 | 76,495.4 | 86,568.5 | 82,298.0 | 87,435.9 | 91,729.2 | 84,592.7 | 92,526.8 | 89,071.0 | 91,755.7 | 84,511.7 | 79,428.2 |
| 2001 | 83,101.9 | 83,195.4 | 88,973.5 | 87,630.8 | 87,467.8 | 90,367.1 | 89,309.5 | 93,919.2 | 90,978.5 | 95,787.5 | 88,781.8 | 80,929.8 |
| 2002 | 85,351.8 | 81,495.8 | 79,422.7 | 88,331.2 | 92,325.4 | 92,354.8 | 91,873.9 | 95,204.7 | 93,669.0 | 95,571.0 | 87,898.2 | 84,392.7 |
| 2003 | 85,551.6 | 86,855.8 | 86,978.3 | 94,059.0 | 91,147.2 | 92,977.6 | 96,840.8 | 96,069.0 | 100,349.1 | 101,649.6 | 88,854.7 | 87,950.2 |
| 2004 | 82,610.5 | 85,695.3 | 97,519.2 | 102,577.4 | 99,731.4 | 103,114.8 | 99,607.9 | 102,265.4 | 107,787.2 | 106,287.4 | 102,630.0 | 98,612.8 |
| 2005 | 90,497.2 | 95,059.8 | 104,635.3 | 102,908.1 | 106,500.9 | 111,570.7 | 105,824.3 | 112,330.3 | 104,707.4 | 103,335.9 | 100,198.4 | 97,851.5 |
| 2006 | 92,405.7 | 99,141.4 | 104,147.9 | 100,653.5 | 107,143.7 | 111,441.2 | 107,982.6 | 114,906.2 | 116,680.9 | 115,482.5 | 113,249.3 | 101,406.0 |
| 2007 | 19,873.3 | 18,272.6 | 16,650.5 | 17,865.3 | 17,745.0 | 21,120.3 | 20,635.1 | 22,423.3 | 21,902.1 | 24,930.2 | 21,478.5 | 19,454.3 |
| 2008 | 21,205.4 | 18,867.9 | 18,675.3 | 19,107.9 | 21,028.2 | 22,095.5 | 19,338.5 | 20,222.7 | 17,524.5 | 20,345.5 | 16,937.0 | 17,688.1 |
| 2009 | 15,517.3 | 14,266.9 | 15,977.5 | 14,793.5 | 13,907.3 | 17,682.9 | 14,234.4 | 12,838.9 | 14,835.9 | 11,893.2 | 10,920.3 | 11,538.5 |
| 2010 | 9,912.3 | 11,387.8 | 11,195.1 | 11,630.6 | 10,629.0 | 9,349.8 | 7,760.6 | 8,339.2 | 6,066.1 | 5,222.2 | 5,911.2 | 6,883.0 |
| 2011 | 5,498.2 | 4,102.1 | 4,993.1 | 4,688.5 | W | 4,447.7 | 4,727.4 | 5,639.9 | 6,082.0 | 4,915.3 | 4,677.8 | 5,076.4 |
| 2012 | 3,832.6 | 4,070.7 | 3,812.7 | 4,192.7 | 4,066.3 | 3,845.3 | 3,402.2 | 3,174.0 | 2,684.4 | 1,641.4 | 2,083.4 | 1,270.2 |
| 2013 | 1,296.9 | 2,158.5 | 1,677.8 | 2,589.8 | 1,976.7 | 1,020.9 | 2,521.9 | 2,944.3 | 2,205.9 | 3,904.5 | 2,626.6 | 2,796.8 |
| 2014 | 1,633.4 | W | W | 1,152.5 | W | W | W | W | W | W | W | W |
| 2015 | W | W | W | W | W | W | W | W | W | W | W | W |
| 2016 | W | W | W | W | W | W | W | W | W | W | W | W |
| 2017 | W | W | W | W | W | W | W | W | 3,399.3 | 3,343.9 | W | W |
| 2018 | W | W | 581.1 | W | W | W | W | W | W | W | W | W |
| 2019 | - | - | W | - | W | W | - | W | - | - | W | - |
| 2020 | - | W | W | W | - | - | - | W | - | - | - | - |
| 2021 | - | - | - | - | - | - | - | W | - | - | - | - |
| 2022 | - | - | - | |||||||||
| - = No Data Reported; -- = Not Applicable; NA = Not Available; W = Withheld to avoid disclosure of individual company data. |
| Release Date: 6/1/2022 |
| Next Release Date: TBD |