|
Download Data (XLS File) |
|
||||||||
|
||||||||
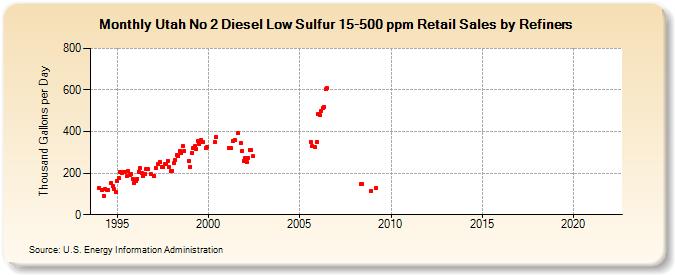
| Utah No 2 Diesel Low Sulfur 15-500 ppm Retail Sales by Refiners (Thousand Gallons per Day) | ||||||||
| Year | Jan | Feb | Mar | Apr | May | Jun | Jul | Aug | Sep | Oct | Nov | Dec |
|---|---|---|---|---|---|---|---|---|---|---|---|---|
| 1994 | 128.0 | W | 116.7 | 92.4 | 123.4 | 121.0 | 117.2 | W | 152.6 | 137.0 | 121.9 | 111.5 |
| 1995 | 163.0 | 174.8 | 204.7 | 201.0 | 204.5 | 204.8 | 184.5 | 209.1 | 193.3 | 196.4 | 173.8 | 154.3 |
| 1996 | 164.1 | 173.3 | 206.1 | 222.4 | 200.2 | 184.8 | 196.0 | 218.5 | 218.6 | W | 195.3 | W |
| 1997 | 184.6 | 224.9 | W | 241.9 | 253.4 | 230.5 | 230.0 | 242.9 | 243.1 | 260.2 | 229.1 | 211.3 |
| 1998 | 210.2 | 249.4 | 264.5 | 285.8 | 280.9 | 307.7 | 296.2 | 331.5 | 305.4 | W | W | 258.8 |
| 1999 | 231.5 | 297.2 | 322.8 | 329.3 | 317.1 | 356.1 | 340.0 | 358.8 | 349.7 | W | 322.1 | 327.5 |
| 2000 | W | W | W | W | 350.4 | 373.5 | W | W | W | W | W | W |
| 2001 | W | 320.4 | W | 320.1 | 356.1 | 361.5 | W | 391.7 | W | 342.8 | 307.2 | 259.6 |
| 2002 | 272.6 | 253.0 | 274.8 | 312.5 | 309.1 | 280.1 | W | W | W | W | W | W |
| 2003 | W | W | W | W | W | W | W | W | W | W | W | W |
| 2004 | W | W | W | W | W | W | W | W | W | W | W | W |
| 2005 | W | W | W | W | W | W | W | 350.2 | 329.2 | NA | 323.8 | 350.1 |
| 2006 | 484.1 | 477.5 | 499.8 | 511.9 | 520.0 | 602.3 | 607.8 | W | W | W | W | W |
| 2007 | W | W | W | W | W | W | W | W | W | W | W | W |
| 2008 | W | W | W | W | 147.2 | 148.3 | W | W | W | W | W | 115.5 |
| 2009 | W | W | 128.6 | W | W | W | W | W | W | W | W | W |
| 2010 | W | W | W | W | W | W | W | W | W | W | W | W |
| 2011 | W | W | W | W | W | W | W | W | W | W | W | W |
| 2012 | W | W | W | W | W | - | - | - | - | - | - | - |
| 2013 | - | - | - | - | - | - | - | - | - | - | - | - |
| 2014 | - | - | - | - | - | - | - | - | - | - | - | - |
| 2015 | - | - | - | - | - | - | - | - | - | - | - | - |
| 2016 | - | - | - | - | - | - | - | - | - | - | - | - |
| 2017 | - | - | - | - | - | - | - | - | - | - | - | - |
| 2018 | - | - | - | - | - | - | - | - | - | - | - | - |
| 2019 | - | - | - | - | - | - | - | - | - | - | - | - |
| 2020 | - | - | - | - | - | - | - | - | - | - | - | - |
| 2021 | - | - | - | - | - | - | - | - | - | - | - | - |
| 2022 | - | - | - | |||||||||
| - = No Data Reported; -- = Not Applicable; NA = Not Available; W = Withheld to avoid disclosure of individual company data. |
| Release Date: 6/1/2022 |
| Next Release Date: TBD |