|
Download Data (XLS File) |
|
||||||||
|
||||||||
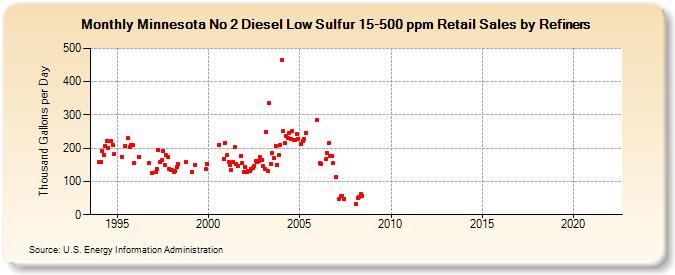
| Minnesota No 2 Diesel Low Sulfur 15-500 ppm Retail Sales by Refiners (Thousand Gallons per Day) | ||||||||
| Year | Jan | Feb | Mar | Apr | May | Jun | Jul | Aug | Sep | Oct | Nov | Dec |
|---|---|---|---|---|---|---|---|---|---|---|---|---|
| 1994 | 159.3 | 158.9 | 192.9 | 180.1 | 206.1 | 221.4 | 201.1 | W | 220.4 | 210.2 | 182.1 | W |
| 1995 | W | W | W | 172.8 | W | 207.0 | W | 229.5 | 202.7 | 209.3 | 209.3 | 156.9 |
| 1996 | W | W | 174.4 | W | W | W | W | W | W | 156.0 | W | 124.8 |
| 1997 | W | 127.2 | 138.6 | 195.9 | 158.3 | 163.1 | 192.5 | 150.7 | 178.8 | 173.4 | 136.9 | 134.7 |
| 1998 | 134.9 | 128.0 | 131.1 | 142.5 | 153.1 | W | W | W | W | 158.9 | W | W |
| 1999 | W | 128.9 | W | 150.0 | W | W | W | W | W | W | 137.2 | 153.9 |
| 2000 | W | W | W | W | W | W | W | 209.7 | W | W | 168.3 | 216.1 |
| 2001 | 178.1 | 158.8 | 149.6 | 135.2 | 158.9 | 203.7 | 153.1 | 146.3 | W | 177.5 | 154.1 | 127.3 |
| 2002 | 144.1 | 128.2 | 132.2 | 132.6 | 137.3 | 139.0 | 147.8 | 162.0 | 158.4 | 162.2 | 172.4 | 164.0 |
| 2003 | 145.4 | 136.8 | 249.8 | 130.9 | 335.6 | 153.7 | 184.7 | 171.0 | 205.9 | 148.5 | 178.7 | 209.5 |
| 2004 | 464.0 | 250.4 | 215.5 | 235.5 | 230.6 | 245.5 | 228.3 | 252.5 | 224.6 | 224.5 | 242.6 | 227.7 |
| 2005 | W | 211.7 | 222.6 | 227.3 | 245.6 | W | W | W | W | W | W | 283.6 |
| 2006 | W | 154.5 | 152.5 | W | W | 167.0 | 186.2 | 215.4 | 175.8 | 177.3 | 156.1 | W |
| 2007 | 114.0 | W | 47.5 | 54.8 | 55.9 | 46.3 | W | W | W | W | W | W |
| 2008 | W | 33.7 | 50.5 | 53.8 | 62.5 | 57.7 | W | W | W | W | W | W |
| 2009 | W | W | W | W | W | W | W | W | W | W | W | W |
| 2010 | W | W | W | W | W | W | W | W | W | W | W | W |
| 2011 | W | W | W | W | W | W | W | W | W | W | W | W |
| 2012 | W | W | W | W | W | W | W | - | - | - | - | - |
| 2013 | - | - | - | - | - | - | - | - | - | - | - | - |
| 2014 | - | - | - | - | - | - | - | - | - | - | - | - |
| 2015 | - | - | - | - | - | - | - | - | - | - | - | - |
| 2016 | - | - | - | - | - | - | - | - | - | - | - | - |
| 2017 | - | - | - | - | - | - | - | - | - | - | - | - |
| 2018 | - | - | - | - | - | - | - | - | - | - | - | - |
| 2019 | - | - | - | - | - | - | - | - | - | - | - | - |
| 2020 | - | - | - | - | - | - | - | - | - | - | - | - |
| 2021 | - | - | - | - | - | - | - | - | - | - | - | - |
| 2022 | - | - | - | |||||||||
| - = No Data Reported; -- = Not Applicable; NA = Not Available; W = Withheld to avoid disclosure of individual company data. |
| Release Date: 6/1/2022 |
| Next Release Date: TBD |