|
Download Data (XLS File) |
|
||||||||
|
||||||||
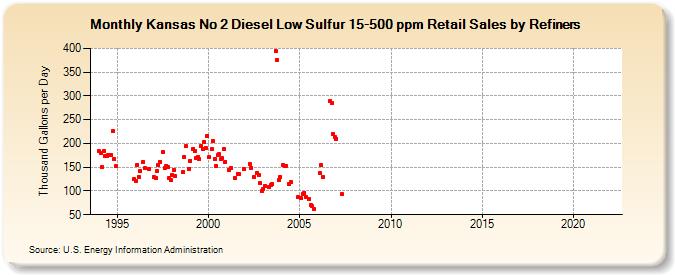
| Kansas No 2 Diesel Low Sulfur 15-500 ppm Retail Sales by Refiners (Thousand Gallons per Day) | ||||||||
| Year | Jan | Feb | Mar | Apr | May | Jun | Jul | Aug | Sep | Oct | Nov | Dec |
|---|---|---|---|---|---|---|---|---|---|---|---|---|
| 1994 | 183.5 | 180.1 | 149.7 | 183.1 | 173.6 | 173.1 | 175.6 | W | 176.1 | 225.3 | 167.3 | 152.4 |
| 1995 | W | W | W | W | W | W | W | W | W | W | W | 125.6 |
| 1996 | 121.2 | 155.6 | 130.0 | 141.6 | W | 161.3 | 147.6 | W | W | 145.9 | W | W |
| 1997 | 129.1 | 128.3 | 141.7 | 154.0 | 161.0 | W | 181.4 | 148.2 | 152.7 | 150.3 | 126.4 | 123.6 |
| 1998 | 133.0 | 145.0 | 130.8 | W | W | W | W | 139.7 | 171.8 | 194.0 | W | 147.0 |
| 1999 | 163.6 | W | 189.1 | 183.6 | 170.1 | 171.8 | 166.8 | 194.2 | 189.2 | 203.5 | 189.9 | 216.5 |
| 2000 | 171.2 | W | 188.1 | 204.7 | 167.6 | 152.0 | 175.3 | 176.8 | 167.6 | 168.4 | 187.4 | 161.7 |
| 2001 | W | 144.3 | W | 148.8 | W | 127.1 | W | 136.3 | 135.9 | W | W | 146.9 |
| 2002 | W | W | W | 156.8 | 149.2 | W | 130.4 | W | 137.9 | 133.9 | 115.8 | 99.5 |
| 2003 | 104.6 | 111.0 | W | W | 108.0 | 113.2 | 114.6 | W | 394.8 | 376.3 | 122.4 | 129.7 |
| 2004 | W | 154.4 | 152.6 | 153.3 | W | 113.6 | 118.3 | W | W | W | W | 87.6 |
| 2005 | W | 84.4 | 94.1 | 96.4 | 87.8 | W | 82.8 | 69.8 | 68.3 | 62.1 | W | W |
| 2006 | W | 137.9 | 154.1 | 128.9 | W | W | W | W | 288.8 | 284.4 | 219.9 | 213.5 |
| 2007 | 210.1 | W | W | W | 92.7 | W | W | W | W | W | W | W |
| 2008 | W | W | W | W | W | W | W | W | W | W | W | W |
| 2009 | W | W | - | - | - | - | - | - | - | - | - | - |
| 2010 | - | - | - | - | - | - | - | - | - | - | - | - |
| 2011 | - | - | - | - | - | - | - | - | - | - | - | - |
| 2012 | - | - | - | - | - | - | - | - | - | - | - | - |
| 2013 | - | - | - | - | - | - | - | - | - | - | - | - |
| 2014 | - | - | - | - | - | - | - | - | - | - | - | - |
| 2015 | - | - | - | - | - | - | - | - | - | - | - | - |
| 2016 | - | - | - | - | - | - | - | - | - | - | - | - |
| 2017 | - | - | - | - | - | - | - | - | - | - | - | - |
| 2018 | - | - | - | - | - | - | - | - | - | - | - | - |
| 2019 | - | - | - | - | - | - | - | - | - | - | - | - |
| 2020 | - | - | - | - | - | - | - | - | - | - | - | - |
| 2021 | - | - | - | - | - | - | - | - | - | - | - | - |
| 2022 | - | - | - | |||||||||
| - = No Data Reported; -- = Not Applicable; NA = Not Available; W = Withheld to avoid disclosure of individual company data. |
| Release Date: 6/1/2022 |
| Next Release Date: TBD |