|
Download Data (XLS File) |
|
||||||||
|
||||||||
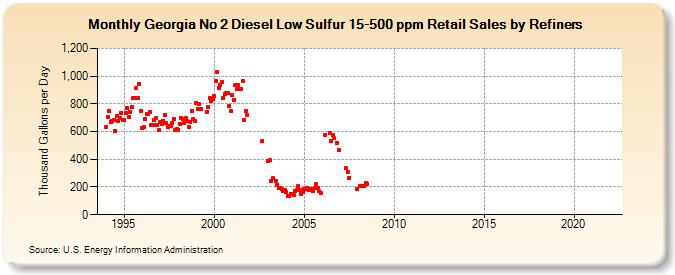
| Georgia No 2 Diesel Low Sulfur 15-500 ppm Retail Sales by Refiners (Thousand Gallons per Day) | ||||||||
| Year | Jan | Feb | Mar | Apr | May | Jun | Jul | Aug | Sep | Oct | Nov | Dec |
|---|---|---|---|---|---|---|---|---|---|---|---|---|
| 1994 | 635.2 | 703.7 | 747.9 | 669.6 | 678.0 | 682.6 | 605.2 | 711.5 | 672.9 | 699.1 | 736.9 | 680.2 |
| 1995 | 681.8 | 734.8 | 772.4 | 704.5 | 742.3 | 777.8 | 842.2 | 842.6 | 911.0 | 845.3 | 939.7 | 748.2 |
| 1996 | 622.5 | 633.2 | 691.4 | 726.2 | 728.7 | 743.0 | 647.5 | 650.1 | 683.0 | 697.9 | 650.7 | 609.7 |
| 1997 | 666.3 | 655.1 | 678.6 | 719.3 | 662.0 | 632.4 | 643.4 | 636.5 | 662.1 | 689.3 | 611.0 | 617.3 |
| 1998 | 612.2 | 658.0 | 696.0 | 693.1 | 658.3 | 697.4 | 676.2 | 632.2 | 668.8 | 745.9 | 694.0 | 675.0 |
| 1999 | 809.0 | 759.9 | 797.0 | 762.3 | W | W | W | 740.1 | 776.1 | 842.7 | 819.9 | 834.4 |
| 2000 | 855.2 | 963.1 | 1,026.8 | 916.1 | 938.3 | 959.7 | 842.3 | 873.9 | 875.3 | 876.3 | 787.8 | 749.9 |
| 2001 | 861.1 | 826.5 | 935.1 | 903.9 | 932.5 | 908.9 | 904.8 | 962.8 | 682.6 | 747.1 | 716.7 | W |
| 2002 | W | W | W | W | W | W | W | W | 528.3 | W | W | W |
| 2003 | 384.7 | 394.6 | 243.5 | 262.2 | W | 241.0 | 215.1 | 193.8 | 193.9 | 188.4 | 171.3 | 176.8 |
| 2004 | 163.5 | 133.5 | 134.9 | 151.6 | 149.9 | 145.8 | 169.7 | 181.1 | 204.5 | 181.2 | 148.3 | 161.5 |
| 2005 | 182.9 | 185.0 | 195.7 | 180.2 | 187.5 | 186.0 | 174.6 | 193.3 | 220.7 | 195.0 | 168.4 | 158.1 |
| 2006 | W | W | 574.5 | W | W | 587.9 | 530.6 | 572.0 | 551.3 | W | 515.8 | 464.2 |
| 2007 | W | W | W | W | 334.7 | 304.6 | 268.2 | W | W | W | W | 182.0 |
| 2008 | W | 208.4 | 206.2 | 207.3 | 205.1 | 229.0 | 222.5 | W | W | W | W | W |
| 2009 | W | W | W | W | W | W | W | W | W | W | W | W |
| 2010 | W | W | W | W | W | W | W | W | W | - | W | - |
| 2011 | W | W | W | W | - | - | W | - | - | - | - | - |
| 2012 | - | - | - | - | - | W | W | W | W | W | - | W |
| 2013 | W | - | - | - | - | - | - | - | - | - | - | - |
| 2014 | - | - | - | - | - | - | W | - | - | - | - | - |
| 2015 | - | - | - | - | - | - | - | - | - | - | - | - |
| 2016 | - | - | - | - | - | - | - | - | - | - | - | - |
| 2017 | - | - | - | - | - | - | - | - | - | - | - | - |
| 2018 | - | - | - | - | - | - | - | - | - | - | - | - |
| 2019 | - | - | - | - | - | - | - | - | - | - | - | - |
| 2020 | - | - | - | - | - | - | - | - | - | - | - | - |
| 2021 | - | - | - | - | - | - | - | - | - | - | - | - |
| 2022 | - | - | - | |||||||||
| - = No Data Reported; -- = Not Applicable; NA = Not Available; W = Withheld to avoid disclosure of individual company data. |
| Release Date: 6/1/2022 |
| Next Release Date: TBD |