|
Download Data (XLS File) |
|
||||||||
|
||||||||
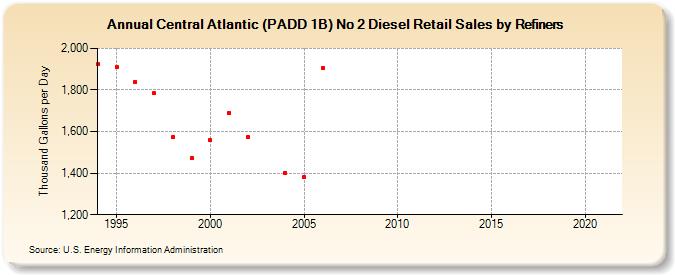
| Central Atlantic (PADD 1B) No 2 Diesel Retail Sales by Refiners (Thousand Gallons per Day) | ||||||||
| Decade | Year-0 | Year-1 | Year-2 | Year-3 | Year-4 | Year-5 | Year-6 | Year-7 | Year-8 | Year-9 |
|---|---|---|---|---|---|---|---|---|---|---|
| 1990's | 1,924.4 | 1,909.1 | 1,839.1 | 1,783.6 | 1,573.4 | 1,472.2 | ||||
| 2000's | 1,558.1 | 1,689.9 | 1,573.2 | W | 1,400.7 | 1,379.1 | 1,906.8 | NA | NA | NA |
| 2010's | NA | NA | NA | NA | NA | NA | NA | NA | NA | NA |
| 2020's | NA |
| - = No Data Reported; -- = Not Applicable; NA = Not Available; W = Withheld to avoid disclosure of individual company data. |
| Release Date: 6/1/2022 |
| Next Release Date: TBD |