|
Download Data (XLS File) |
|
||||||||
|
||||||||
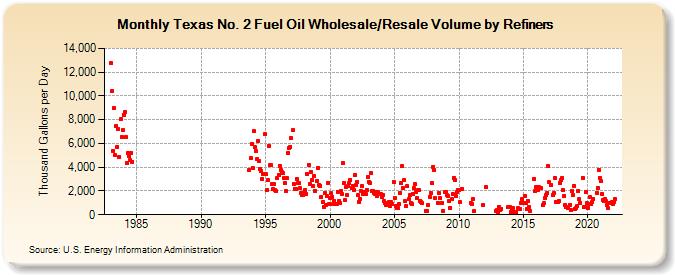
| Texas No. 2 Fuel Oil Wholesale/Resale Volume by Refiners (Thousand Gallons per Day) | ||||||||
| Year | Jan | Feb | Mar | Apr | May | Jun | Jul | Aug | Sep | Oct | Nov | Dec |
|---|---|---|---|---|---|---|---|---|---|---|---|---|
| 1983 | 12,756.1 | 10,404.9 | 5,388.7 | 8,956.9 | 5,018.4 | 7,481.2 | 5,688.8 | 7,206.2 | 4,892.6 | 8,031.8 | 6,556.4 | 7,101.9 |
| 1984 | 8,387.6 | 8,613.0 | 6,523.5 | 4,343.8 | 5,184.9 | 4,924.1 | 4,569.5 | 5,223.9 | 4,476.1 | |||
| 1993 | 3,759.2 | 4,759.2 | 5,994.0 | |||||||||
| 1994 | 3,966.8 | 7,016.4 | 5,675.5 | 5,364.7 | 4,657.4 | 6,237.3 | 4,515.5 | 3,810.1 | 3,696.4 | 3,022.9 | 3,435.5 | 6,763.5 |
| 1995 | 3,387.5 | 2,081.1 | 2,894.4 | 5,809.6 | 4,172.9 | 4,183.2 | 2,543.3 | 2,161.3 | 2,573.9 | 2,042.5 | 1,990.2 | 3,053.5 |
| 1996 | 3,357.1 | 4,133.2 | 3,770.5 | 3,611.9 | 3,489.0 | 3,076.2 | 2,669.8 | 1,983.2 | 3,066.5 | 5,217.6 | 5,574.3 | 5,740.1 |
| 1997 | 6,454.6 | 7,090.1 | 2,601.6 | 2,202.4 | 2,190.3 | 3,000.6 | 2,689.7 | 2,642.9 | 2,246.6 | 1,859.2 | 1,620.5 | 1,647.7 |
| 1998 | 1,794.0 | 2,041.4 | 1,744.5 | 3,387.3 | 4,218.2 | 2,565.1 | 3,615.9 | 2,916.1 | 2,396.5 | 3,249.5 | 2,033.3 | W |
| 1999 | 2,830.6 | 3,963.5 | 2,539.4 | 2,450.6 | 1,527.8 | 1,040.8 | 681.6 | 1,815.9 | 833.5 | 1,585.9 | 2,703.7 | 910.1 |
| 2000 | 1,417.4 | 1,786.3 | 1,530.0 | 938.2 | 1,164.1 | 930.2 | 890.4 | 1,937.2 | 1,139.3 | 1,027.3 | 2,027.8 | 1,725.1 |
| 2001 | 4,338.8 | 2,685.8 | 1,223.7 | 2,359.5 | 1,631.1 | 2,378.8 | 2,634.9 | 2,939.6 | 2,236.2 | 2,450.3 | 2,120.4 | 3,332.6 |
| 2002 | 2,482.6 | 2,789.1 | 1,635.2 | 1,074.3 | 1,326.3 | 1,985.1 | 2,401.6 | 1,729.8 | 1,881.8 | 1,709.0 | 2,077.4 | 3,209.7 |
| 2003 | 2,792.7 | 2,671.4 | 3,469.5 | 1,987.2 | 1,990.5 | 1,829.0 | 1,764.6 | 1,929.9 | 1,609.7 | 1,878.8 | W | 1,767.5 |
| 2004 | 1,489.5 | 1,639.2 | 1,124.4 | 949.2 | 826.3 | 879.0 | 953.4 | 1,071.5 | 754.0 | 1,049.8 | 886.7 | 2,775.8 |
| 2005 | 1,409.8 | 712.6 | 571.1 | 563.9 | 877.1 | 1,856.5 | 2,667.8 | 4,086.8 | 2,222.1 | 2,916.4 | 1,145.9 | 746.9 |
| 2006 | 2,382.2 | 1,317.6 | 1,618.7 | 995.6 | 882.8 | 1,773.6 | 2,224.5 | 2,551.5 | 1,916.1 | 1,392.6 | 2,105.5 | 2,055.5 |
| 2007 | 1,185.8 | 1,044.3 | 962.6 | W | W | 333.3 | 329.1 | 783.8 | W | 1,517.2 | 1,785.8 | 2,636.4 |
| 2008 | 4,054.7 | 3,777.4 | 1,381.1 | NA | 1,027.4 | 1,827.7 | 1,417.7 | W | 990.8 | 348.4 | W | 1,947.3 |
| 2009 | 1,940.9 | 1,642.8 | 1,535.2 | 1,114.9 | 604.2 | 1,299.4 | 1,744.2 | 3,130.8 | 2,946.5 | 1,545.4 | 1,922.0 | 2,081.6 |
| 2010 | 2,071.3 | 1,042.8 | W | 2,191.1 | W | W | W | W | W | W | W | 990.6 |
| 2011 | 934.9 | 1,312.9 | 279.5 | W | W | W | W | W | W | W | 817.3 | W |
| 2012 | W | 2,317.6 | W | W | W | W | W | W | W | W | 345.1 | 379.4 |
| 2013 | 223.1 | 651.1 | 433.0 | 522.7 | W | W | W | W | W | W | 615.7 | 609.8 |
| 2014 | 237.2 | 487.7 | 583.2 | 215.7 | W | 210.1 | W | 562.5 | 521.5 | 495.7 | 986.9 | 1,304.3 |
| 2015 | 989.8 | 1,566.5 | 991.2 | 507.8 | 1,162.0 | 665.1 | 331.0 | W | W | W | 3,011.2 | 1,967.4 |
| 2016 | 2,373.5 | 2,066.9 | 2,333.6 | 2,220.2 | 2,274.6 | W | 791.4 | 960.3 | 1,415.1 | 1,637.4 | 1,837.1 | 4,067.5 |
| 2017 | 2,726.0 | W | 2,501.7 | 1,648.7 | 1,801.1 | 3,128.5 | 1,094.5 | 1,091.5 | 1,075.8 | 1,171.7 | 2,640.1 | 2,909.1 |
| 2018 | 3,107.8 | 2,075.8 | 1,596.6 | 811.5 | 684.8 | 595.0 | W | 821.5 | 371.2 | 1,963.2 | 1,674.4 | 2,455.7 |
| 2019 | 517.8 | 589.6 | 743.5 | 2,017.2 | 1,300.3 | 996.6 | W | 3,114.6 | 639.3 | 672.8 | 1,919.8 | 1,023.7 |
| 2020 | 532.2 | 912.5 | 1,449.5 | 870.5 | 1,099.0 | 1,337.2 | W | W | 1,862.0 | 2,269.6 | 3,796.1 | 3,120.7 |
| 2021 | 2,810.8 | 1,767.4 | 1,200.7 | 1,159.8 | 1,350.4 | 1,137.2 | 836.2 | 556.0 | 1,003.1 | W | 1,054.6 | 910.0 |
| 2022 | 1,097.5 | 1,287.9 | W | |||||||||
| - = No Data Reported; -- = Not Applicable; NA = Not Available; W = Withheld to avoid disclosure of individual company data. |
| Release Date: 6/1/2022 |
| Next Release Date: TBD |