|
Download Data (XLS File) |
|
||||||||
|
||||||||
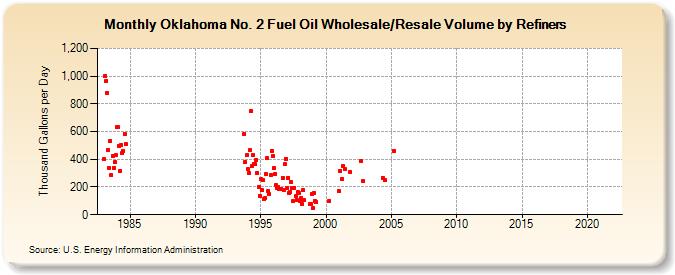
| Oklahoma No. 2 Fuel Oil Wholesale/Resale Volume by Refiners (Thousand Gallons per Day) | ||||||||
| Year | Jan | Feb | Mar | Apr | May | Jun | Jul | Aug | Sep | Oct | Nov | Dec |
|---|---|---|---|---|---|---|---|---|---|---|---|---|
| 1983 | 401.9 | 1,000.6 | 964.2 | 881.0 | 469.7 | 339.1 | 531.8 | 285.8 | 427.2 | 339.4 | 377.9 | 430.6 |
| 1984 | 632.0 | 632.0 | 498.1 | 317.4 | 506.0 | 442.5 | 460.0 | 579.3 | 508.8 | |||
| 1993 | 581.0 | 380.0 | 427.7 | |||||||||
| 1994 | 327.6 | 302.9 | 463.4 | 746.3 | 349.4 | 429.4 | 362.5 | 362.7 | 393.4 | 301.7 | 201.7 | 138.1 |
| 1995 | 255.3 | 175.9 | 248.7 | 110.0 | 119.8 | 290.9 | 406.6 | 171.9 | 149.3 | 285.5 | 459.0 | 424.0 |
| 1996 | 337.2 | 294.8 | 212.6 | 190.0 | 197.4 | 183.4 | 184.4 | 184.4 | 267.5 | 179.2 | 363.3 | 405.5 |
| 1997 | 195.9 | 267.9 | 157.0 | 166.4 | 233.1 | 193.4 | 95.9 | 194.8 | 133.0 | 109.3 | 162.8 | 158.6 |
| 1998 | 95.6 | 121.8 | 73.9 | 175.3 | 104.9 | W | W | W | W | 75.4 | 79.6 | 150.0 |
| 1999 | 49.4 | 158.0 | 96.0 | 93.1 | W | W | W | W | W | W | W | W |
| 2000 | W | W | W | 101.7 | W | W | W | W | W | W | W | W |
| 2001 | 169.6 | 317.2 | W | 259.1 | 349.9 | 332.4 | W | W | W | W | 309.9 | W |
| 2002 | W | W | W | W | W | W | W | W | 386.4 | W | 241.2 | W |
| 2003 | W | W | W | W | W | W | W | W | W | W | W | W |
| 2004 | W | W | W | W | 267.2 | W | 248.7 | W | W | W | W | W |
| 2005 | W | W | 459.9 | W | W | W | W | W | W | W | W | W |
| 2006 | W | W | W | W | W | W | W | W | W | W | W | W |
| 2007 | W | W | W | W | W | - | - | - | - | - | - | - |
| 2008 | - | - | - | - | - | - | - | - | - | - | - | - |
| 2009 | - | - | - | - | - | - | - | - | - | - | - | - |
| 2010 | - | - | - | - | - | - | - | - | - | - | - | - |
| 2011 | - | - | - | - | - | - | - | - | - | - | - | - |
| 2012 | - | - | - | - | - | - | - | - | - | - | - | - |
| 2013 | - | - | - | - | - | - | - | - | - | - | - | - |
| 2014 | - | - | - | - | - | - | - | - | - | - | - | - |
| 2015 | - | - | - | - | - | - | - | - | - | - | - | - |
| 2016 | - | - | - | - | - | - | - | - | - | - | - | - |
| 2017 | - | - | - | - | - | - | - | - | - | - | - | - |
| 2018 | - | - | - | - | - | - | - | - | - | - | - | - |
| 2019 | - | - | - | - | - | - | - | - | - | - | - | - |
| 2020 | - | - | - | - | - | - | - | - | - | - | - | - |
| 2021 | - | - | - | - | - | - | - | - | - | - | - | - |
| 2022 | - | W | - | |||||||||
| - = No Data Reported; -- = Not Applicable; NA = Not Available; W = Withheld to avoid disclosure of individual company data. |
| Release Date: 6/1/2022 |
| Next Release Date: TBD |